. 2009 May;136(5):1783-95.e10.
doi: 10.1053/j.gastro.2009.01.007. Epub 2009 Jan 14.

Role of transglutaminase 2 in liver injury via cross-linking and silencing of transcription factor Sp1

Affiliations

Role of transglutaminase 2 in liver injury via cross-linking and silencing of transcription factor Sp1

Hideki Tatsukawa et al. Gastroenterology. 2009 May.

Abstract

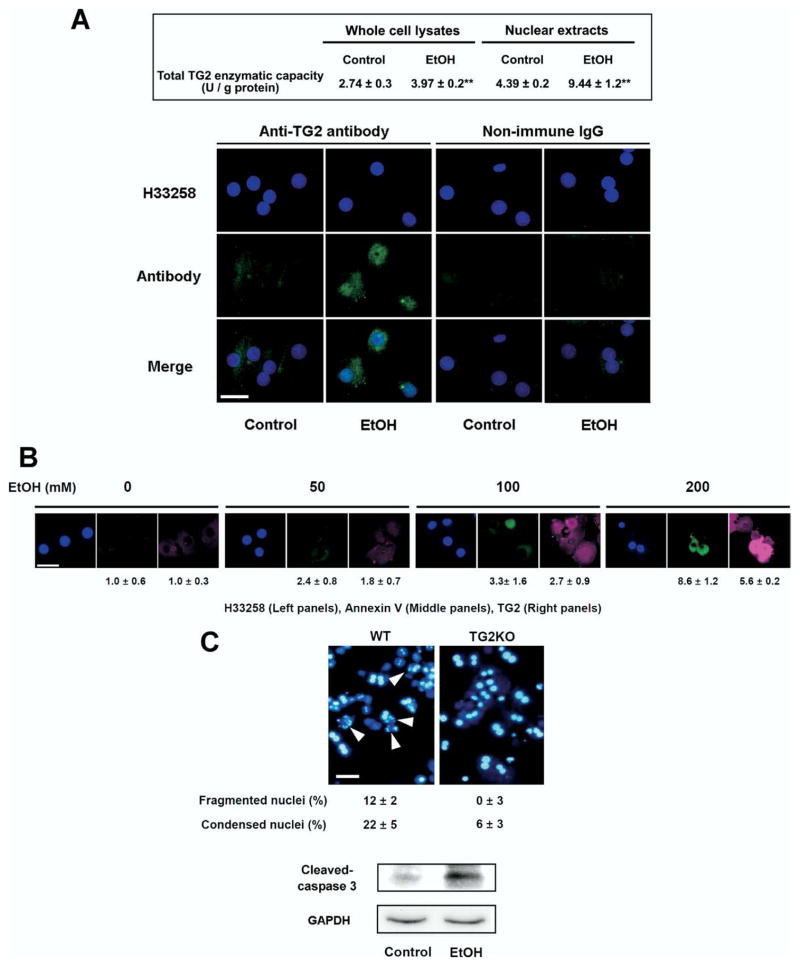
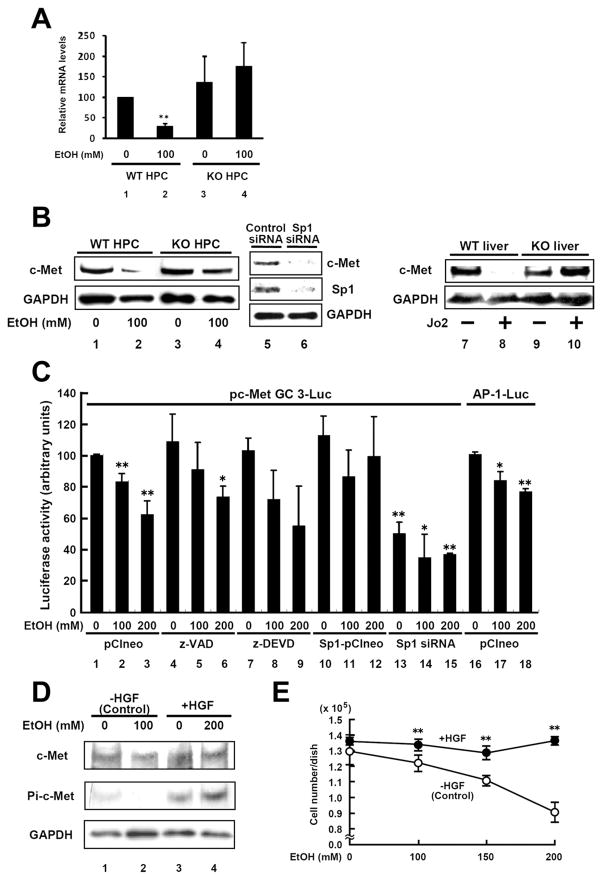
Background & aims: Despite high morbidity and mortality of alcoholic liver disease worldwide, the molecular mechanisms underlying alcohol-induced liver cell death are not fully understood. Transglutaminase 2 (TG2) is a cross-linking enzyme implicated in apoptosis. TG2 levels and activity are increased in association with various types of liver injury. However, how TG2 induces hepatic apoptosis is not known.

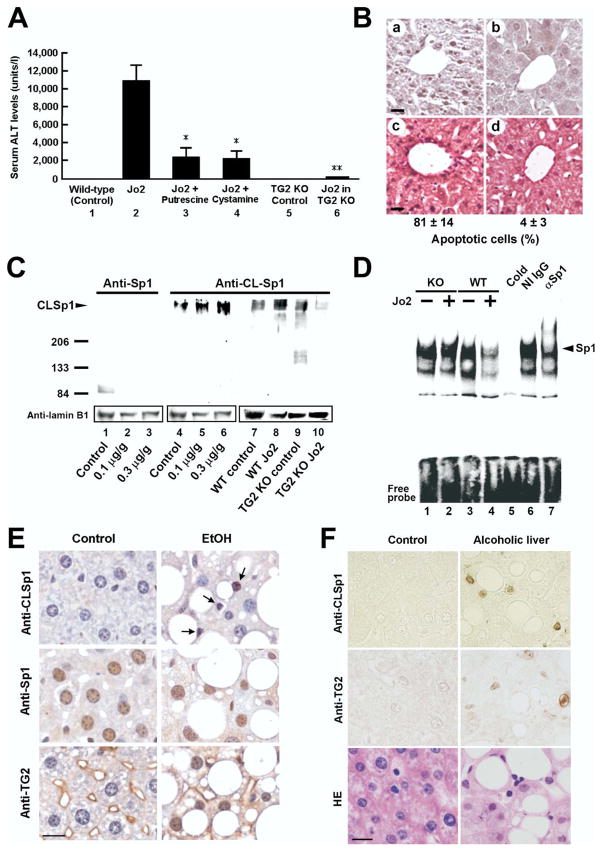
Methods: Human hepatic cells or primary hepatocytes from rats or TG2+/+ and TG2-/- mice were treated with ethanol. Mice were administered anti-Fas antibody or alcohol. Liver sections were prepared from patients with alcoholic steatohepatitis. Changes in TG2 levels, Sp1 cross-linking and its activities, expression of hepatocyte growth factor receptor, c-Met, and hepatic apoptosis were measured.

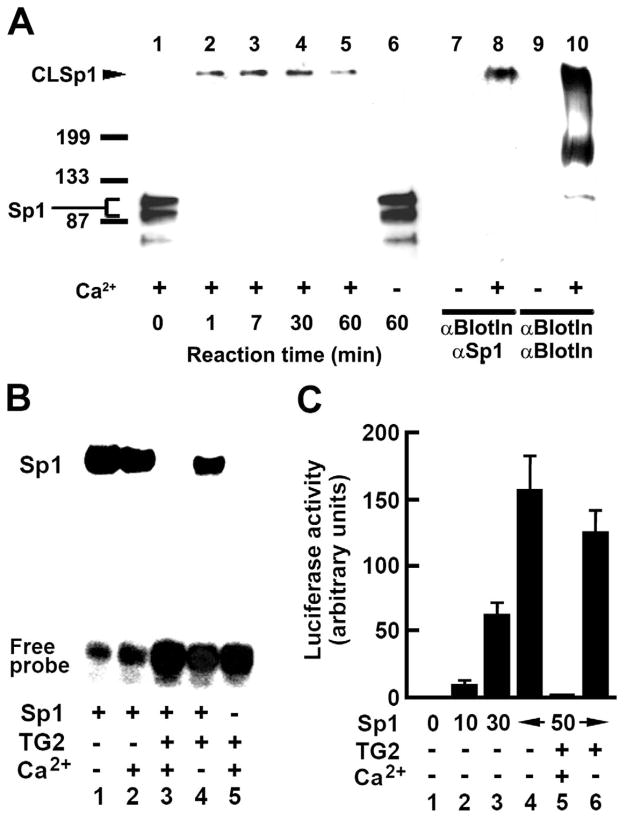
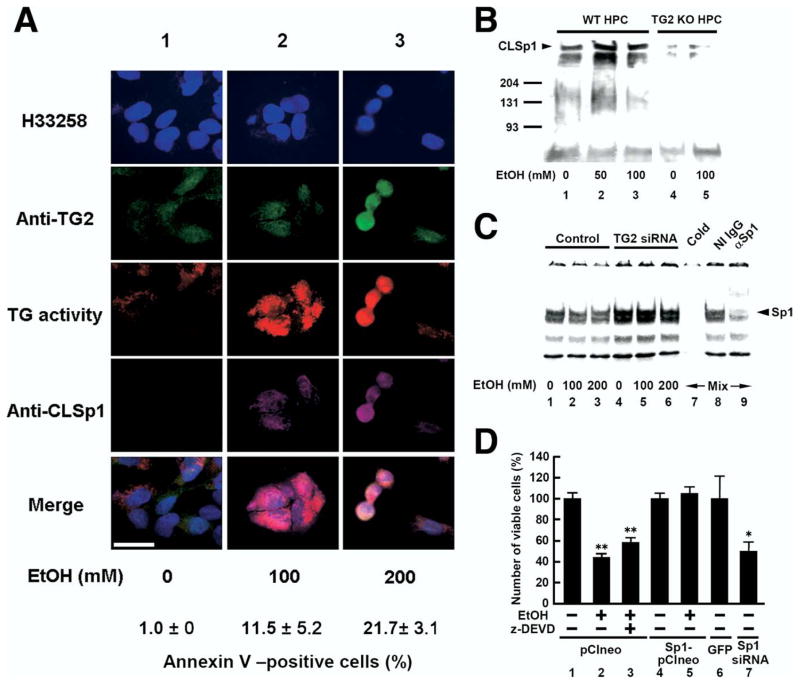
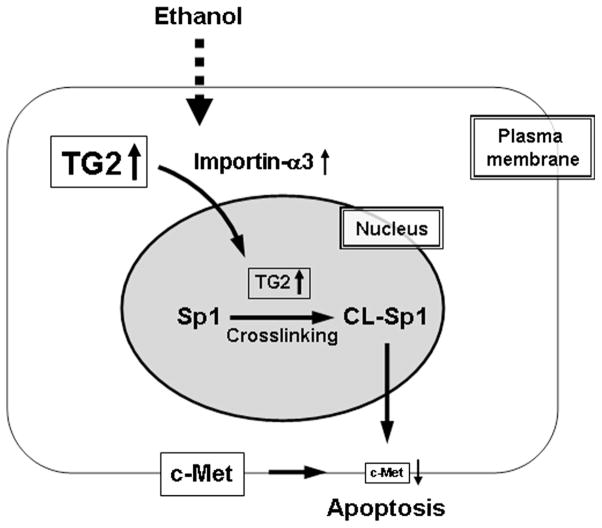
Results: Ethanol induced apoptosis in hepatic cells, enhanced activity and nuclear accumulation of TG2 as well as accumulation of cross-linked and inactivated Sp1, and reduced expression of the Sp1-responsive gene, c-Met. These effects were rescued by TG2 knockdown, restoration of functional Sp1, or addition of hepatocyte growth factor, whereas apoptosis was reproduced by Sp1 knockdown or TG2 overexpression. Compared with TG2+/+ mice, TG2-/- mice showed markedly reduced hepatocyte apoptosis and Sp1 cross-linking following ethanol or anti-Fas treatment. Treatment of TG2+/+ mice with the TG2 inhibitors putrescine or cystamine blocked anti-Fas-induced hepatic apoptosis and Sp1 silencing. Moreover, enhanced expression of cross-linked Sp1 and TG2 was evident in hepatocyte nuclei of patients with alcoholic steatohepatitis.

Conclusions: TG2 induces hepatocyte apoptosis via Sp1 cross-linking and inactivation, with resultant inhibition of the expression of c-Met required for hepatic cell viability.


Conflict of interest statement

Conflicts of interest

The authors disclose no conflicts.

Figures

Figure 1
Figure 1
Augmented production and nuclear translocation of TG2 in ethanol-treated hepatocytes. (A) Rat hepatocytes were treated with 0 or 100 mmol/L ethanol overnight and total TG2 enzymatic capacity (activity) in whole cell lysates and in nuclear protein extracts was determined. **P < .01 compared with controls. Representative confocal images of parallel cultures fixed and stained with either anti-TG2 polyclonal antibody or rabbit nonimmune IgG plus Alexa 488 conjugate anti-rabbit IgG. Scale bar = 50 μm. (B) Rat hepatocytes were treated with 0–200 mmol/L ethanol overnight. After staining using Annexin V/fluorescein isothiocyanate (middle panels), cells were fixed and stained with Hoechst 33258 (left panels) and anti-TG2 polyclonal antibody (right panels). The intensity of cell imaging more than 3×10³ was quantified by the cell-based imaging system Celaview. The percentage of apoptotic (Annexin V–positive) and nuclear TG2-positive cells are indicated under each micrograph. Scale bar = 50 μm. (C) Hepatocytes from either TG2+/+ or TG2−/− mice were treated with 50 mmol/L ethanol for 4 hours and nuclei stained with Hoechst 33258. Arrowheads show fragmented nuclei. Scale bar = 50 μm. The percentage of nuclei undergoing fragmentation or condensation versus total nuclei is indicated. Lower panels indicate the levels of cleaved caspase-3 and glyceraldehyde-3-phosphate dehydrogenase in TG2+/+ hepatocytes. AC show representative findings from 3 different experiments.
Figure 2
Figure 2
Inactivation of Sp1 by TG2-mediated cross-linking in vitro. (A) Sp1 and guinea pig TG2 (400 nmol/L each) were incubated at 37°C for the times indicated in the presence or absence of 10 mmol/L Ca2+ (lanes 1–6) or mixed and incubated with 100 μmol/L 5-BAPA for 3 hours in the absence or presence of 10 mmol/L Ca2+ in HEPES-buffered saline followed by immunoprecipitation of 5-BAPA–incorporated proteins with anti-biotin antibody–conjugated agarose beads (lanes 7–10). Changes in the molecular size of Sp1 were analyzed by Western blotting with either anti-Sp1 antibody (αSp1, lanes 1–8) or anti-biotin antibody (αbiotin, lanes 9 and 10). Molecular weight markers (kilodaltons) are indicated. (B) After incubating Sp1 for 1 hour with or without TG2 as described in A, and in the absence or presence of 10 mmol/L Ca2+, as indicated, changes in DNA binding activity were examined by gel shift assays using the consensus GC box oligonucleotide as a probe. (C) Sp1 (0–50 ng) was incubated with 20 nmol/L TG2 in the absence or presence of 10 mmol/L Ca2+ overnight in HEPES-buffered saline. The reaction mixture was dialyzed and incubated (90 minutes at 30°C) with 20 μL of the TNT T7 Quick Master Mix solution and GC3-Luc vector. Sp1-dependent transcription was determined by monitoring luciferase activity. Lanes 1–4, increase in reporter activity with increasing Sp1 amount; lanes 5 vs 6, disappearance of Sp1 (50 ng)-dependent transactivation activity following preincubation with TG2. Results shown are means ± SD (n = 3). AC show representative findings from 3 different experiments.
Figure 3
Figure 3
Ethanol induces TG2-dependent apoptosis via cross-linking and inactivation of Sp1 in HepG2 cells. (A) HepG2 cells treated with 0–200 mmol/L ethanol plus both 0.2 mmol/L 5-BAPA and 100μmol/L aminoguanidine for 24 hours were fixed and stained with Hoechst 33258 (upper row), anti-TG2 polyclonal antibody (second row), tetramethylrhodamine isothiocyanate–conjugate streptavidin (third row), or anti–CL-Sp1 antibody (fourth row). The results of merging the 4 images are shown in the bottom panels (Merge). Apoptotic (Annexin V–positive) cells, determined by flow cytometry and expressed a percent of control, are indicated under each column. Scale bar = 50 μm. (B) Hepatocytes isolated from TG2+/+ (WT; lanes 1–3) or TG2−/− (lanes 4 and 5) mice were treated with 0–100 mmol/L ethanol for 24 hours in the presence of 5-BAPA. Nuclear extracts were prepared and in situ incorporation of 5-BAPA into CL-Sp1 was assessed by Western blotting with an anti-Sp1 antibody. (C) HepG2 cells stably overexpressing green fluorescent protein (control; lanes 1–3) or TG2 siRNA (lanes 4–6) were treated with 0–200 mmol/L ethanol for 24 hours. Sp1 DNA binding activity of nuclear extracts was determined by gel shift assay using a consensus GC box as a probe. Lane 7, mixed nuclear extracts + 50-fold excess of unlabeled probe (cold); lane 8, + nonimmune (NI) IgG; lane 9, + anti-Sp1 IgG (αSp1). Detailed information about the cells used is described in Supplementary Figure 2A (see supplemental material online at www.gastrojournal.org). (D) HepG2 cells transfected with pCIneo vector (controls, lanes 1–3) or Sp1-pCIneo (lanes 4 and 5), or HepG2 cells stably overexpressing green fluorescent protein (lane 6) or Sp1 siRNA (lane 7), were seeded in 1 × 10⁵ cells/3.5-cm dishes and treated with 0 or 200 mmol/L ethanol in the absence or presence of the caspase inhibitor Z-DEVD for 48 hours. Results shown are the number of viable cells relative to the controls expressed as percent±S.D. *P<.05, **P<.01 compared with control cells (lane 1). Detailed information about the cells used is described in Supplementary Figure 2B (see supplemental material online at www.gastrojournal.org). AD show representative findings from 3 different experiments.
Figure 4
Figure 4
TG2−/− mice are resistant to hepatic injury due to reduced formation of cross-linked and inactivated Sp1. (A) Jo2 (0.1 μg/g) was administered to TG2+/+ (lanes 2–4) and TG2−/− (lane 6) mice. Some animals intraperitoneally received putrescine (5 mg/kg) or cystamine (18 μg/kg) 30 minutes before Jo2 administration, as indicated. Serum ALT levels were determined as described in Materials and Methods 24 hours after Jo2 treatment. *P<.05, **P<.01 compared with Jo2 treatment alone in TG2+/+ mice. (B) Twenty-four hours after administration of Jo2 to TG2+/+ (panels a and c) and TG2−/− (panels b and d) mice, livers were sectioned and either frozen for double staining of terminal deoxynucleotidyl transferase–mediated deoxyuridine triphosphate nick-end labeling and hematoxylin or fixed, embedded in paraffin, and stained with H&E. The percentage of apoptotic cells observed for each sample was indicated. Scale bars = 50 μm. (C) Twenty-four hours after administration of the indicated doses of Jo2 to TG2+/+ (lanes 1–8) or TG2−/− mice (lanes 9 and 10), liver extracts were prepared and assessed by Western blotting for Sp1 monomer or CL-Sp1 using the antisera indicated. Polyvinylidene difluoride membranes from the studies in lanes 1–10 were reprobed with anti-lamin B1. (D) Twenty-four hours after administration of Jo2 to TG2−/− (lanes 1 and 2) or TG2+/+ mice (lanes 3–7), DNA binding activity of Sp1 in liver extracts was assessed by gel shift assay using a consensus GC box as the probe. Lanes 1, 3, and 5–7, controls; lanes 2 and 4, Jo2; lane 5, +50-fold excess of unlabeled probe (cold); lane 6, + nonimmune antibody (NI IgG); lane 7, + anti-Sp1 IgG (αSp1). (E) Liver sections from mice with alcoholic steatohepatitis were stained with anti–CL-Sp1 (30 μg/mL), anti-Sp1 (5 μg/mL), or polyclonal anti-TG2 (30 μg/mL) antibodies, and the signals were enhanced using an ABC kit and developed with DAB substrate. Sections were counterstained with hematoxylin. Serum ALT levels (mean ± SD, n = 5) were 14 ± 2 U/L (controls) and 299 ± 121 U/L (ethanol treated). Scale bar = 50 μm. (F) Human alcoholic liver and control samples were stained with anti–CL-Sp1 (30 μg/mL), monoclonal anti-TG2 (30 μg/mL), or H&E. Noncancerous regions of the liver from a patient with uterine cancer with hepatic metastases were used as the controls. Staining signals were enhanced using the Envision+ system, horseradish peroxidase, detection (Dako, Carpinteria, CA) and developed with DAB substrate. Sections were counterstained with hematoxylin. Scale bar = 50 μm. More than 6 mice were used for each experiment in AE. AF show representative findings from 3 different experiments that all gave similar results.
Figure 5
Figure 5
Ethanol impairs the expression of Sp1-regulated growth factor receptor genes. (A) Hepatocytes from TG2+/+ (lanes 1 and 2) or TG2−/− mice (lanes 3 and 4) were treated with 0 or 100 mmol/L ethanol for 15 hours, and c-Met messenger RNA in cell lysates was quantitated by real-time polymerase chain reaction. Values show mean±SD. **P<.01 compared with controls. (B) Hepatocytes from TG2+/+ (lanes 1 and 2) or TG2−/− mice (lanes 3 and 4) were treated with 0 or 100 mmol/L ethanol for 48 hours, or HepG2 cells were transfected with scrambled Sp1 siRNA oligo (control, lane 5) or Sp1 siRNA (lane 6) and incubated for 48 hours. Hepatocyte or HepG2 total cell extracts were then prepared. Lanes 7–10: Twenty-four hours after administration of either saline (−) or Jo2 (+) to TG2+/+ (lanes 7 and 8) or TG2−/− mice (lanes 9 and 10), animals were killed and liver extracts prepared. c-Met, glyceraldehyde-3-phosphate dehydrogenase, and Sp1 protein expression in total cell extracts or liver whole extracts was assessed by Western blotting. (C) One day after transfection of HepG2 cells with c-Met promoter GC3-Luc (lanes 1–15) or AP-1 Luc reporter (lanes 16–18), cells were treated with either 0–200 mmol/L ethanol for 24 hours in the absence (lanes 1–3) or presence of 50 μg/ml z-VAD (lanes 4–6) or z-DEVD (lanes 7–9) or cotransfected with Sp1-pCIneo (lanes 10–12) or Sp1 siRNA (lanes 13–15) vector. Results shown are means ± SD (n = 3). *P < .05, **P < .01 compared with controls. (D) After treatment of HepG2 cells with 0–100 mmol/L ethanol for 24 hours in the absence (lanes 1 and 2) or presence of 10 ng/mL HGF (lanes 3 and 4), cell lysates were prepared and c-Met (upper row), phospho (Pi)-c-Met protein (middle row), and glyceraldehyde-3-phosphate dehydrogenase (bottom row) expression were determined by Western blotting. (E) Rat hepatocytes were treated with 0–200 mmol/L ethanol for 24 hours in the absence (open circles) or presence (closed circles) of 10 ng/mL HGF and the number of viable cells were determined after trypsinization by Trypan blue dye exclusion. Results shown are means ± SD (n = 3). **P < .01 for HGF-treated vs untreated cells. AE show representative findings from 3 different experiments that all gave similar results.
Figure 6
Figure 6
Schematic showing the molecular mechanism by which ethanol causes hepatic apoptosis via TG2-mediated cross-linking and silencing of Sp1, thereby reducing c-Met–mediated HGF signaling.

Comment in

Similar articles

Cited by

References

    1. Ribeiro PS, Cortez-Pinto H, Solá S, et al. Hepatocyte apoptosis, expression of death receptors, and activation of NF-κB in the liver of nonalcoholic and alcoholic steatohepatitis patients. Am J Gastroenterol. 2004;99:1708–1717. - PubMed
    1. Lorand L, Graham RM. Transglutaminases: cross-linking enzymes with pleiotropic functions. Nat Rev Mol Cell Biol. 2003;4:140–156. - PubMed
    1. Fésüs L, Piacentini M. Transglutaminase 2: an enigmatic enzyme with diverse functions. Trends Biochem Sci. 2002;27:534–539. - PubMed
    1. Griffin M, Casadio R, Bergamini CM. Transglutaminases: nature’s biological glues. Biochem J. 2002;368:377–396. - PMC - PubMed
    1. Mirza A, Liu SL, Frizell E, et al. A role for tissue transglutaminase in hepatic injury and fibrogenesis, and its regulation by NF-kB. Am J Physiol. 1997;272:G281–G288. - PubMed

Publication types

MeSH terms

Associated data