. 2009 May;136(5):1741-9.e6.
doi: 10.1053/j.gastro.2009.01.008. Epub 2009 Jan 14.

Inhibition of gamma-secretase activity inhibits tumor progression in a mouse model of pancreatic ductal adenocarcinoma

Affiliations

Inhibition of gamma-secretase activity inhibits tumor progression in a mouse model of pancreatic ductal adenocarcinoma

Ruben Plentz et al. Gastroenterology. 2009 May.

Abstract

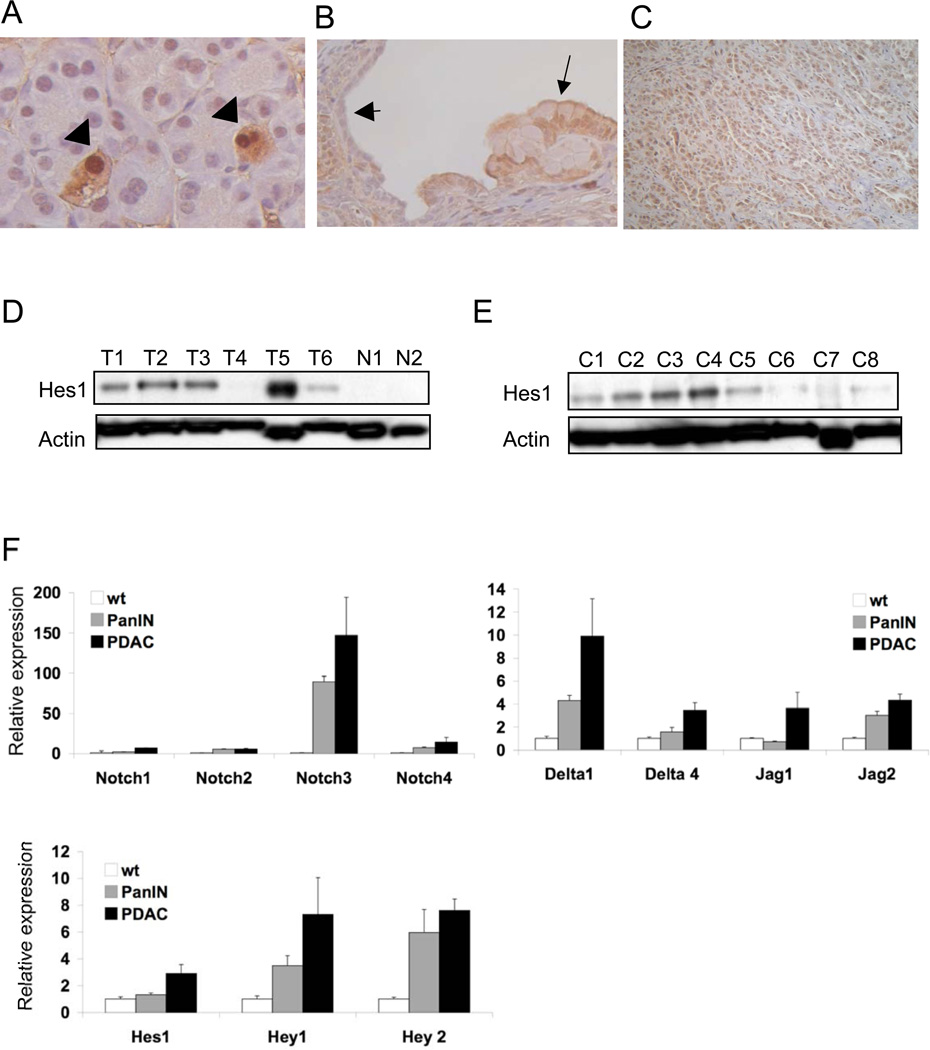
Background & aims: The Notch signaling pathway is required for the expansion of undifferentiated pancreatic progenitor cells during embryonic development and has been implicated in the progression of pancreatic ductal adenocarcinoma (PDAC). The interaction of Notch ligands with their receptors promotes a gamma-secretase-dependent cleavage of the Notch receptor and release of the Notch intracellular domain, which translocates to the nucleus and activates transcription. We investigated the role of this pathway in PDAC progression.

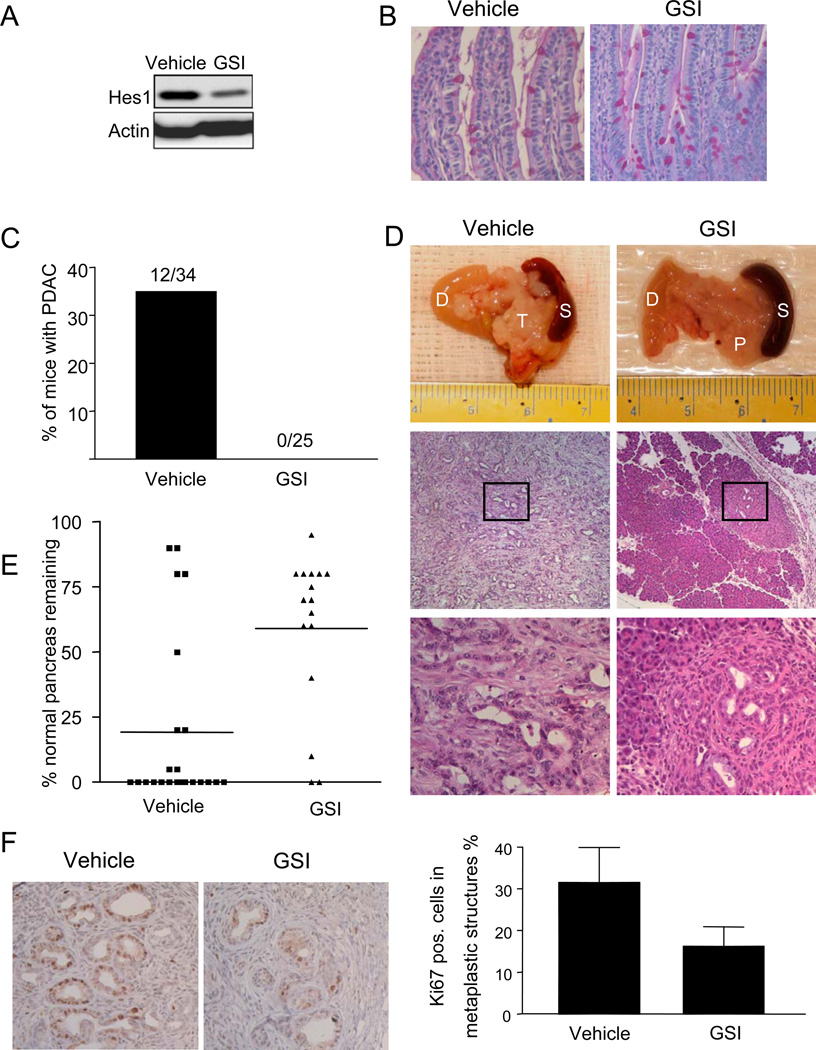
Methods: We tested the effects of a gamma-secretase inhibitor (GSI) that blocks Notch signaling in PDAC cell lines and a genetically engineered mouse model of PDAC (Kras p53 L/+ mice).

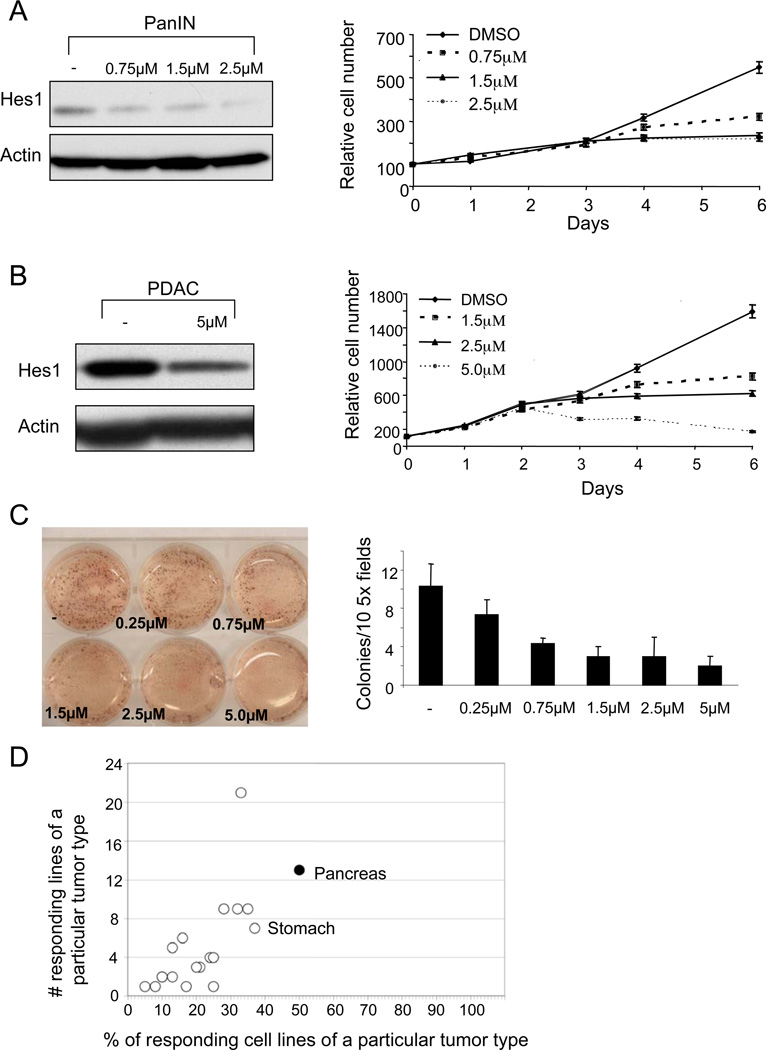
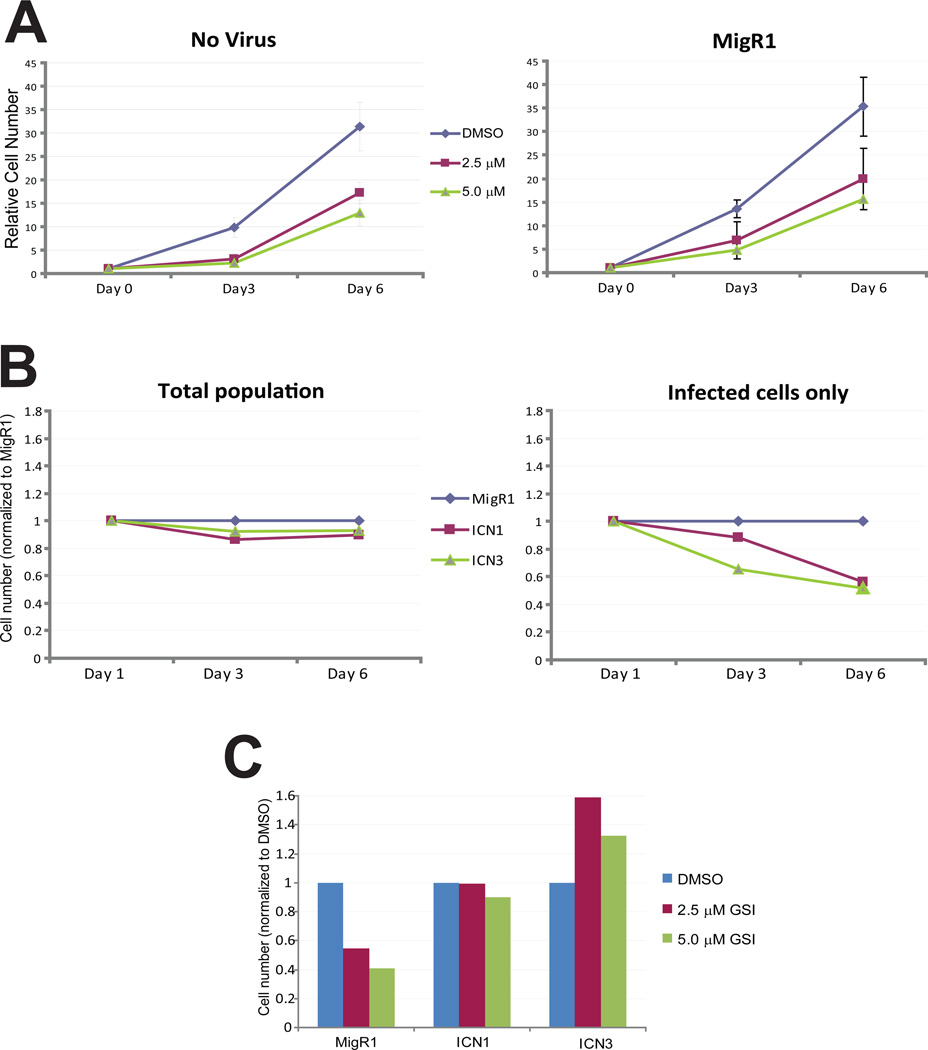
Results: Notch signaling was activated in PDAC precursors and advanced tumors. The GSI inhibited the growth of premalignant pancreatic duct-derived cells in a Notch-dependent manner. Additionally, in a panel of over 400 human solid tumor-derived cell lines, PDAC cells, as a group, were more sensitive to the GSI than any other tumor type. Finally, the GSI completely inhibited tumor development in the genetically engineered model of invasive PDAC (P < .005, chi2 test; compared with mice exposed to vehicle).

Conclusions: These results suggest that Notch signaling is required for PDAC progression. Pharmacologic targeting of this pathway offers therapeutic potential in this treatment-refractory malignancy.


Figures

Figure 1
Figure 1. Notch pathway activation accompanies PDAC progression
The Notch reporter strain [24] confirms pathway activation in normal pancreatic centroacinar cells A, arrowheads) and PanIN lesions of Pdx1-Cre LSL-KrasG12D p53 L/+ mice (B). Note staining in PanIN epithelium (arrows) but not in adjacent normal ductal epithelium arrowhead). (C) Hes1 is widely expressed in the tumor cells of advanced mouse PDAC. D) Western blot analysis demonstrates a significant increase in Hes1 expression in primary mouse PDAC tumors (T1–T6) and (E) PDAC cell lines (C1–C8) compared to normal pancreatic tissue (N1, N2). (F) Quantitative reverse transcription-PCR (qRTPCR) analysis of Notch pathway components in cultured wildtype duct cells, duct cells derived from PanIN-bearing pancreata, and PDAC cells (mean +/− SEM of 3 independent lines for each group). A,B and C, original magnification 400×.
Figure 2
Figure 2. PanIN and PDAC cell lines are sensitive to GSI treatment
(A) PanIN cells treated with the indicated concentrations of the GSI exhibit decreased levels of Hes1 protein by Western blot analysis (left) and a dose-dependent shift in the growth curve right). (B) Treatment of the mouse PDAC cell line (N490) with the GSI results in a similar decrease in Hes1 protein levels (left) and growth inhibition (right). Note that most treatment conditions led to a plateau in the growth curves, suggesting that the compound exerts static rather than toxic effects. (C) Soft agar assay of a GSI-treated human PDAC cell line (Panc1), with quantitation on right. Note significant difference between colony numbers in cells treated with ≥1.5µM GSI compared to vehicle-treated cells (p<0.005; Student’s T test). (D) A set of 434 human cancer-derived cell lines comprising 23 different solid tumor types were assessed for growth inhibition following 3 days of exposure to 5 µM MRK-003. The proportion of cell lines from each tumor type that showed >25% decreased growth is plotted on the X-axis (% responders) and the total number of responders is plotted on the y-axis. In addition to pancreatic cancer-derived cell lines (50%; 13/26), only stomach cancer-derived cell lines (37%; 7/19) also showed a response rate of >35%.
Figure 3
Figure 3. GSI attenuates PDAC development in Kras p53 mice
(A) Tumor cells were transplanted as xenografts into SCID mice, and the mice were treated systemically with GSI or vehicle, resulting in a decrease in Hes1 protein levels. (B) PAS staining of small intestine from control and GSI-treated mice, showing an increase in goblet cells in the GSI-treated animal. (C) PDAC incidence in GSI-treated and control mice at ages 11–13 weeks. (D) Macroscopic and histological images of representative pancreas (P), tumor (T), and surrounded duodenum (D) and spleen (S) from vehicle-treated and GSI-treated mice. The boxed region in the middle panels is shown at higher magnification in the lower panels. The vehicle-treated mouse has a PDAC, while the GSI-treated mouse has focal PanIN lesions. (E) The proportion of pancreatic tissue occupied by PanIN lesions was quantified in vehicle- (N=23) and GSI-treated (N=16) pancreata. GSI treatment resulted in a significant (p<0.005; chi squared test) reduction in the abundance of PanINs. (F) Left panel. Ki67 staining of metaplastic ducts. Right panel. Quantitation of Ki67 staining in the neoplastic epithelium, showing significant (p<0.005; Student’s T test) reduction in Ki67+ cells following GSI treatment. C, magnification 100× and 400×, E, magnification 400×.
Figure 4
Figure 4. Notch signaling rescues cells from the growth inhibitory effects of GSI
(A) Retroviral infection has no effect on growth inhibition of NB507 PDAC cells by MRK-003. Cell number was determined 3 days or 6 days following treatment with the GSI (left panel); infection with MigR1 retrovirus did not alter the dose-response curve. (B) Cell number was determined following infection with control (empty) MigR1 virus, or virus encoding a constitutively active form of Notch1 (ICN1) or Notch3 (ICN3). ICN1 and ICN3 expression had minimal effects on NB507 cell number compared to MigR1 when the total population was examined (left panel); when only infected cells were measured, ICN1and ICN3 had a mild inhibitory effect on growth (right panel). (C) ICN1 and ICN3 prevented GSI-induced growth inhibition after 6 days of treatment (only infected cells are shown). These results are representative of two independent experiments.

Comment in

Similar articles

Cited by

References

    1. Jemal A, Siegel R, Ward E, Hao Y, Xu J, Murray T, Thun MJ. Cancer statistics, 2008. CA Cancer J Clin. 2008;58:71–96. - PubMed
    1. Burris HA, 3rd, Moore MJ, Andersen J, Green MR, Rothenberg ML, Modiano MR, Cripps MC, Portenoy RK, Storniolo AM, Tarassoff P, Nelson R, Dorr FA, Stephens CD, Von Hoff DD. Improvements in survival and clinical benefit with gemcitabine as first-line therapy for patients with advanced pancreas cancer: a randomized trial. J Clin Oncol. 1997;15:2403–2413. - PubMed
    1. Hansel DE, Kern SE, Hruban RH. Molecular pathogenesis of pancreatic cancer. Annu Rev Genomics Hum Genet. 2003;4:237–256. - PubMed
    1. Konieczny SF, Leach SD. Metaplastic metamorphoses in the mammalian pancreas. Gastroenterology. 2007;133:2056–2059. - PubMed
    1. Murtaugh LC, Leach SD. A case of mistaken identity? Nonductal origins of pancreatic "ductal" cancers. Cancer Cell. 2007;11:211–213. - PubMed

Publication types

MeSH terms