. 2009 Apr 17;284(16):10571-82.
doi: 10.1074/jbc.M900752200. Epub 2009 Feb 10.

Characterization of a selective inhibitor of inositol hexakisphosphate kinases: use in defining biological roles and metabolic relationships of inositol pyrophosphates

Affiliations

Characterization of a selective inhibitor of inositol hexakisphosphate kinases: use in defining biological roles and metabolic relationships of inositol pyrophosphates

Usha Padmanabhan et al. J Biol Chem. .

Abstract

Inositol hexakisphosphate kinases (IP6Ks) phosphorylate inositol hexakisphosphate (InsP(6)) to yield 5-diphosphoinositol pentakisphosphate (5-[PP]-InsP(5) or InsP(7)). In this study, we report the characterization of a selective inhibitor, N(2)-(m-(trifluoromethy)lbenzyl) N(6)-(p-nitrobenzyl)purine (TNP), for these enzymes. TNP dose-dependently and selectively inhibited the activity of IP6K in vitro and inhibited InsP(7) and InsP(8) synthesis in vivo without affecting levels of other inositol phosphates. TNP did not inhibit either human or yeast Vip/PPIP5K, a newly described InsP(6)/InsP(7) 1/3-kinase. Overexpression of IP6K1, -2, or -3 in cells rescued TNP inhibition of InsP(7) synthesis. TNP had no effect on the activity of a large number of protein kinases, suggesting that it is selective for IP6Ks. TNP reversibly reduced InsP(7)/InsP(8) levels. TNP in combination with genetic studies was used to implicate the involvement of two pathways for synthesis of InsP(8) in yeast. TNP induced a fragmented vacuole phenotype in yeast, consistent with inhibition of Kcs1, a Saccharomyces cerevisiae IP6K. In addition, it also inhibited insulin release from Min6 cells in a dose-dependent manner further implicating InsP(7) in this process. TNP thus provides a means of selectively and rapidly modulating cellular InsP(7) levels, providing a new and versatile tool to study the biological function and metabolic relationships of inositol pyrophosphates.


Figures

FIGURE 1.
FIGURE 1.
ClustalW alignment of the IPK family members. The following proteins are aligned: hIP3-3KA, hIP6K1, hIP6K2, hIP6K3, Sckcs1, and Scipk2, where the prefix “h” represents H. sapiens and “Sc” represents S. cerevisiae. Accession numbers are as follows: IP3-3KA, NP_002211; IP6K1, NP_695005; IP6K2, NP_057375; IP6K3, NP_473452; Sckcs1, NP_010300; Scipk2p, NP_010458. Amino acids highlighted in black boxes indicate identical residues. Amino acids highlighted in gray boxes indicate the conserved nature of the amino acids (such as hydrophobicity, charge, etc.). The numbers indicate the amino acids from the corresponding protein shown in that line.
FIGURE 2.
FIGURE 2.
Inhibition of IP6K1 and the IP3-3KA activity by TNP in vitro. A, Western blot (WB) analyses of HA-tagged IP6K1 immunoprecipitated (IP) from HeLa cell lysates transiently transfected with HA-tagged IP6K1, which was used for the activity assays shown in Fig. 3B. The protein was immunoprecipitated using anti-HA antibody (5 μg/mg lysate) and analyzed using the anti-Ip6 kinase panantibody. The molecular mass standards (Prescision Plus Protein dual colored standards from Bio-Rad) are indicated. B, HPLC separation of input [2-3H]InsP6 and [2-3H]InsP7 formed during the IP6K1 assay in the presence of DMSO (filled squares) or TNP at 100 nm (open squares), 1 μm (filled circles), or 10 μm (open circles). During the assay, the immunoprecipitated enzyme was incubated with [2-3H]InsP6 and 1 mm ATP in 200 μl of assay buffer for 1 h at 37 °C on a shaking nutator in the presence of DMSO or TNP (various concentrations). C, determination of IC50 of TNP for IP6K. The percentage InsP7 formed is plotted against TNP concentration. InsP7 formed is calculated as the fraction of the radioactivity in the InsP7 peak to the total radioactivity in InsP6 + InsP7 peaks and expressed as a percentage. The error bars show the range of data obtained from duplicates shown in the chromatogram. Curve fitting to the data was done using the Sigma Plot software. D, purity of the IP3-3KA. 50 ng of purified recombinant fragment of IP3-3KA containing the catalytic domain (∼61 kDa) was electrophoresed on a 4–12% Novex BisTris gel in MOPS running buffer. The gel was stained with Coomassie Blue. The molecular mass standards (same as in A) are indicated. E, dose-dependent inhibition of IP3-3KA activity by TNP. Purified IP3-3KA was incubated with [γ-32P] ATP and 5 μm Ins(1,4,5)P3 in assay buffer at 37 °C for 30 min in the presence of the indicated concentrations of TNP. [32P]Pi,[32P]ATP, and [32P]Ins(1,3,4,5)P4 formed during the IP3-3KA activity assay were visualized after separation by PEI-cellulose thin layer chromatography and phosphorimaging. Positions of reactants and origin are marked on the right. The two leftmost lanes marked C are γ-[32P]ATP controls in assay buffer lacking enzyme. F, determination of IC50 of TNP for IP3-3KA. Ins(1,3,4,5)P4 formed was plotted against the corresponding TNP concentration, by quantifying chromatograms in E using the AIDA software. Curve fitting to the data was done using the Sigma Plot software. The error bars show the range of data obtained from duplicates assayed separately.
FIGURE 3.
FIGURE 3.
Inhibition of InsP7 formation in TNP-treated HeLa cells. A, HPLC separation of inositol phosphates extracted from HeLa cells stimulated with DMSO (filled circles) or TNP at 100 nm (open circles), 1 μm (filled squares), or 10 μm (open squares) for 2 h at 37 °C. The cells were grown in inositol-free medium supplemented with 10% (v/v) dialyzed fetal calf serum and 50 μCi of [2-3H]inositol for 3 days, and inositol phosphates were extracted (see “Experimental Procedures”). Since the InsP6 peak did not change by more than 10% between all of the conditions (average in control cells = 564,651 dpm and average in cells treated to 10 μm TNP = 599,011 dpm), the dpm in the InsP6 peak was used to normalize levels of other inositol phosphates. In control HeLa cells, the percentages of InsP3, InsP4, InsP7, and InsP8 with respect to InsP6 are 12, 4, 6, and 0.7%, respectively. Similar values for InsP7 and InsP8 have been reported in DDT1-MF2 cells and HEK cells (30). B, change in InsP5 (filled triangles), InsP3 (filled squares), and InsP4 (open squares) normalized to InsP6 in the presence of increasing TNP. In each case, the total radioactivity under the corresponding peak (base line-subtracted) was divided by the total radioactivity under the InsP6 peak (base line-subtracted) and expressed as a percentage. Data are the mean of two different experiments, each an average of triplicate assays, and error bars represent the S.D. of the data. C, TNP-induced dose-dependent decrease in InsP7. For each concentration of TNP, radioactivity in the [3H]InsP7 peak was normalized to that in the [3H]InsP6 peak. Data are the average of triplicate experiments, and error bars represent the S.D. of the data. Sigma Plot software was used to carry out curve fitting to the InsP7 data, and the IC50 calculation was carried out from the equation used to fit the curve.
FIGURE 4.
FIGURE 4.
IP6K1 over-expression rescues TNP inhibition of InsP7 synthesis. A, HPLC of InsP6 and InsP7 from HeLa cells overexpressing GFP-IP6K1 labeled with [3H]inositol. Cells were stimulated with DMSO (filled circles) or TNP at 100 nm (open circles); 1 μm (open triangles), and 10 μm (closed triangles) for 2 h at 37 °C. The soluble inositol phosphates were extracted and separated as explained under “Experimental Procedures.” B, decrease in InsP7 from HeLa cells overexpressing GFP (filled circles) or GFP-IP6K1 (open circles) as a function of TNP concentration. Data are the average of triplicate experiments, and error bars represent the S.D. of the data. Curve fitting to the InsP7 data was done using the Sigma Plot software, and IC50 calculations were carried out from the equation used to fit the curve.
FIGURE 5.
FIGURE 5.
Effect of TNP and thapsigargin on InsP7 isolated from equilibrium-labeled cells. A, HPLC profiles of inositol phosphates isolated from HeLa cells equilibrium-labeled with [2-3H]inositol and stimulated with DMSO (filled circles) or TNP (10 μm; filled triangles) or TG(open circles) for 2 h at 37 °C. B, bar chart showing InsP3 (white bars), InsP4 (hatched bars), InsP7 (checkered bars), and InsP8 (black bars) as a percentage of InsP6 in cells treated with DMSO, TNP, or TG. Data are the average of duplicate experiments, and error bars show the range of data.
FIGURE 6.
FIGURE 6.
Vip/PPIP5Ks are not inhibited by TNP. 100 ng of purified Vip2 fragment (amino acids 1–365 from the human Vip2) was preincubated with vehicle (DMSO) or 10 μm TNP for 30 min on ice. Following the pretreatment, [γ-32P]ATP and 100 μm InsP6 were added to the enzyme, and the assay was carried out at 37 °C for 60 min as per the protocol reported earlier by Fridy et al. (28). [32P]Pi [32P]ATP, [32P]InsP7, and [32P]InsP8 formed during the Vip/PPIP5K activity assay were visualized after separation by PEI-cellulose thin layer chromatography and phosphorimaging. Positions of ATP and products are marked on the right. The leftmost lane marked C is the [γ-32P]ATP control in assay buffer lacking enzyme.
FIGURE 7.
FIGURE 7.
TNP inhibition of InsP7 synthesis is reversible. A bar chart shows InsP7 as a percentage of InsP6 in HeLa cells treated with DMSO (Control), treated with TNP, or treated with TNP and allowed to recover for 2 h after TNP treatment (Washed). Data are the average of duplicate experiments, and error bars show the range of data.
FIGURE 8.
FIGURE 8.
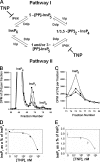
Determination of the predominant pathway to InsP8 synthesis in mammalian cells using TNP. A, metabolic pathways that lead to the synthesis of InsP8 or [PP]2-InsP4 in mammalian cells. Pathway I consists of InsP6 being phosphorylated by IP6K to [PP]-InsP5 or InsP7 and further phosphorylation of InsP7 to InsP8 by Vip/PPIP5Ks. Pathway II consists of the Vip/PPIP5Ks phosphorylating InsP6 to InsP7 and the IP6Ks subsequently phosphorylating the InsP7 to InsP8 (–9). Ddp represents the inositol pyrophosphate phosphatase (34, 35). B, HPLC profiles of higher inositol polyphosphates isolated from [3H]inositol-labeled HeLa cells treated with DMSO (“no sorbitol” controls; closed circles), sorbitol (0.2 m plus DMSO; open circles), and sorbitol (0.2 m) plus 10 μm TNP (filled squares) for 2 h at 37°C. C, the InsP8 peak from A plotted on a smaller scale. The different curves are the same as that described in A. D and E, decrease in InsP7 (filled circles) and InsP8 (open circles) normalized to InsP6 as a function of TNP concentration. Data are the average of triplicate experiments, and error bars represent the S.D. of the data. Curve fitting and calculation of IC50 values for the InsP7 and InsP8 data were done as before.
FIGURE 9.
FIGURE 9.
Inhibition of InsP7 formation in WT yeast cells mimics the defectin vacuole morphology reported for ipk2ΔIPK2 and kcs1Δ strains. WT, kcs1Δ, vip1Δ, and kcs1vip1ΔΔ cells were grown in yeast minimal medium supplemented with 50 μCi/ml [3H]inositol overnight at 30 °C. Inositol phosphates were extracted using a protocol similar to that with mammalian cells. HPLC traces are shown in Fig. S3. For vacuole labeling experiments, WT, ipk2Δ, or kcs1Δ strains of haploid yeast cells were grown in YPD. WT cells were grown in the presence of vehicle (DMSO) or TNP. They were then stained with cell tracker CMAC (blue), which stains the vacuolar lumen and membrane marker MDY-64 (green) according to the manufacturer's instructions. Shown is a comparison of InsP7 levels in WT, WT plus TNP, and kcs1Δ cells (A); vip1Δ, vip1Δ+ TNP, and kcs1vip1ΔΔ cells (B); and ddp1Δ, ddp1Δ+TNP and ddp1kcs1ΔΔ cells (C). D (i), WT cells grown in the presence of vehicle (DMSO). D (ii), WT cells grown in the presence of TNP (10 μm). D (iii), ipk2Δ grown in the presence of vehicle (DMSO). D (iv), kcs1Δ grown in presence of vehicle (DMSO).
FIGURE 10.
FIGURE 10.
Inhibition of insulin released from Min6 cells. A, bar chart showing insulin released by Min6 cells. Cells were pretreated with different concentrations of TNP in glucose-free KREBS for 2 h prior to stimulation of insulin release by 2.5 mm glucose. 5 min after glucose stimulation, insulin contained in the buffer was measured and quantitated using the rat/mouse insulin enzyme-linked immunosorbent assay kit as per the manufacturer's instructions. Data shown are the average of duplicate readings in one experiment. Three such experiments were carried out with similar results. B, bar chart showing insulin released by Min6 cells transfected with IP6K1 and treated with vehicle (DMSO) or TNP (10 μm). Insulin released was measured under similar conditions and at the same time as in A.

Similar articles

Cited by

References

    1. Irvine, R. F. (2005) J. Physiol. (Lond.) 566 295-300 - PMC - PubMed
    1. Shears, S. B. (2004) Biochem. J. 377 265-280 - PMC - PubMed
    1. Luo, H. R., Huang, Y. E., Chen, J. C., Saiardi, A., Iijima, M., Ye, K., Huang, Y., Nagata, E., Devreotes, P., and Snyder, S. H. (2003) Cell 114 559-572 - PubMed
    1. Saiardi, A., Caffrey, J. J., Snyder, S. H., and Shears, S. B. (2000) J. Biol. Chem. 275 24686-24692 - PubMed
    1. Saiardi, A., Erdjument-Bromage, H., Snowman, A. M., Tempst, P., and Snyder, S. H. (1999) Curr. Biol. 9 1323-1326 - PubMed

MeSH terms