

Characterization of the structural features and interactions of sclerostin: molecular insight into a key regulator of Wnt-mediated bone formation
- PMID: 19208630
- PMCID: PMC2667775
- DOI: 10.1074/jbc.M807994200
Characterization of the structural features and interactions of sclerostin: molecular insight into a key regulator of Wnt-mediated bone formation
Abstract
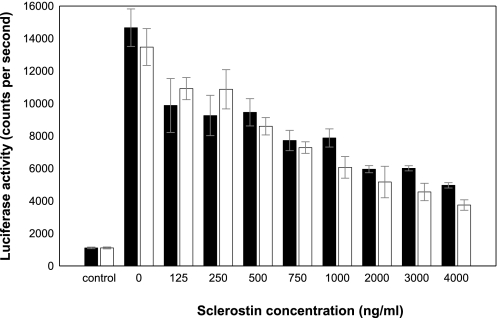
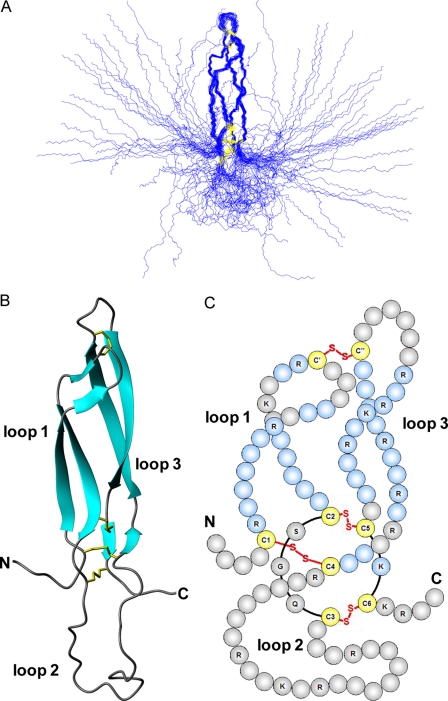
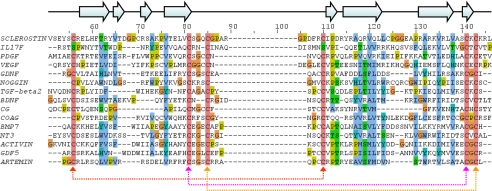
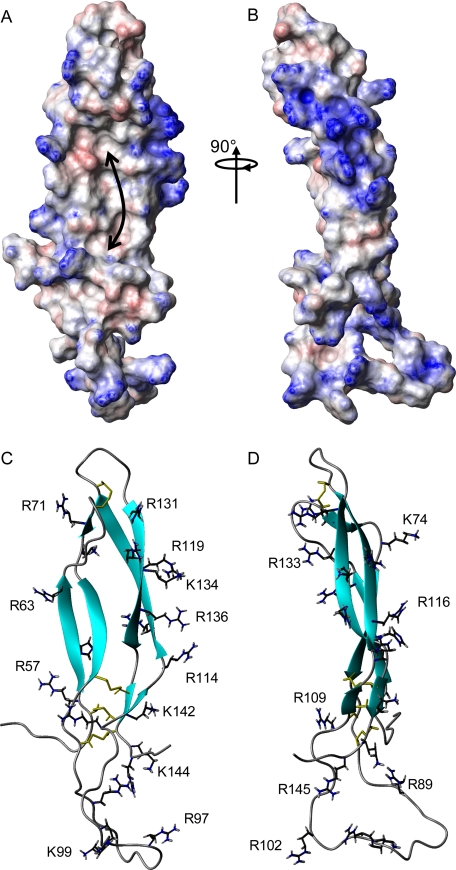
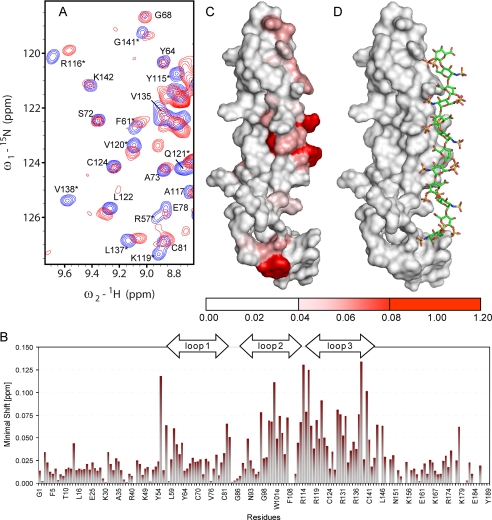
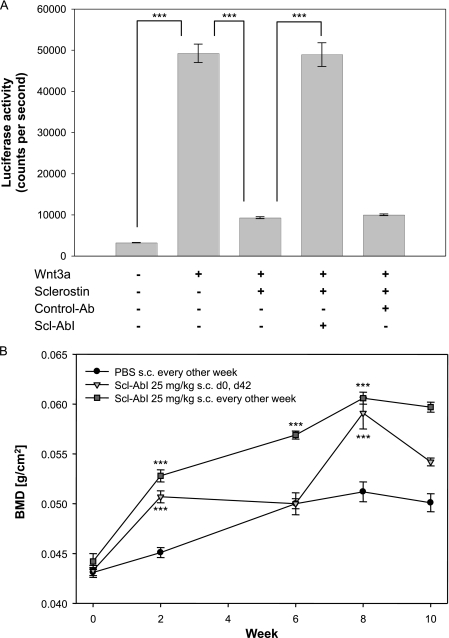
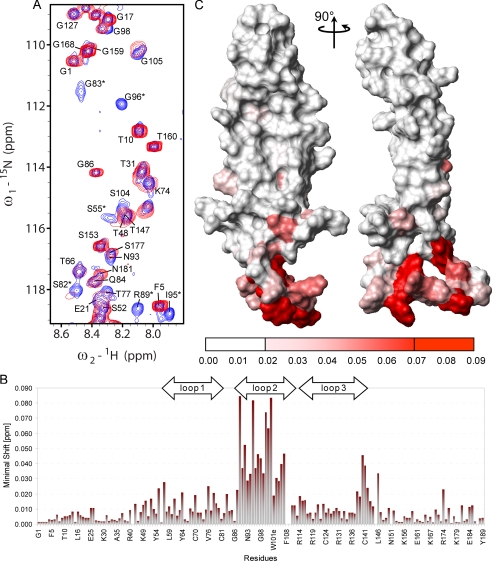
The secreted glycoprotein sclerostin has recently emerged as a key negative regulator of Wnt signaling in bone and has stimulated considerable interest as a potential target for therapeutics designed to treat conditions associated with low bone mass, such as osteoporosis. We have determined the structure of sclerostin, which resulted in the identification of a previously unknown binding site for heparin, suggestive of a functional role in localizing sclerostin to the surface of target cells. We have also mapped the interaction site for an antibody that blocks the inhibition of Wnt signaling by sclerostin. This shows minimal overlap with the heparin binding site and highlights a key role for this region of sclerostin in protein interactions associated with the inhibition of Wnt signaling. The conserved N- and C-terminal arms of sclerostin were found to be unstructured, highly flexible, and unaffected by heparin binding, which suggests a role in stabilizing interactions with target proteins.
Figures
Similar articles
-
An Akt-dependent increase in canonical Wnt signaling and a decrease in sclerostin protein levels are involved in strontium ranelate-induced osteogenic effects in human osteoblasts.J Biol Chem. 2011 Jul 8;286(27):23771-9. doi: 10.1074/jbc.M111.251116. Epub 2011 May 12. J Biol Chem. 2011. PMID: 21566129 Free PMC article.
-
Sclerostin binds to LRP5/6 and antagonizes canonical Wnt signaling.J Biol Chem. 2005 May 20;280(20):19883-7. doi: 10.1074/jbc.M413274200. Epub 2005 Mar 18. J Biol Chem. 2005. PMID: 15778503
-
NMR structure of the Wnt modulator protein Sclerostin.Biochem Biophys Res Commun. 2009 Feb 27;380(1):160-5. doi: 10.1016/j.bbrc.2009.01.062. Epub 2009 Jan 21. Biochem Biophys Res Commun. 2009. PMID: 19166819
-
Osteocyte-derived sclerostin inhibits bone formation: its role in bone morphogenetic protein and Wnt signaling.J Bone Joint Surg Am. 2008 Feb;90 Suppl 1:31-5. doi: 10.2106/JBJS.G.01183. J Bone Joint Surg Am. 2008. PMID: 18292354 Review.
-
Wnt signaling in osteosarcoma.Adv Exp Med Biol. 2014;804:33-45. doi: 10.1007/978-3-319-04843-7_2. Adv Exp Med Biol. 2014. PMID: 24924167 Review.
Cited by
-
Sclerostin alters serum vitamin D metabolite and fibroblast growth factor 23 concentrations and the urinary excretion of calcium.Proc Natl Acad Sci U S A. 2013 Apr 9;110(15):6199-204. doi: 10.1073/pnas.1221255110. Epub 2013 Mar 25. Proc Natl Acad Sci U S A. 2013. PMID: 23530237 Free PMC article.
-
Validation of commercially available ELISAs for the detection of circulating sclerostin in hemodialysis patients.Discoveries (Craiova). 2016;4(1):e55. doi: 10.15190/d.2016.2. Discoveries (Craiova). 2016. PMID: 27088126 Free PMC article.
-
Sclerostin inhibits osteoblast differentiation without affecting BMP2/SMAD1/5 or Wnt3a/β-catenin signaling but through activation of platelet-derived growth factor receptor signaling in vitro.Bonekey Rep. 2015 Nov 4;4:757. doi: 10.1038/bonekey.2015.126. eCollection 2015. Bonekey Rep. 2015. PMID: 26587226 Free PMC article.
-
The Microdamage and Expression of Sclerostin in Peri-implant Bone under One-time Shock Force Generated by Impact.Sci Rep. 2017 Jul 26;7(1):6508. doi: 10.1038/s41598-017-06867-9. Sci Rep. 2017. PMID: 28747741 Free PMC article.
-
Structure of protein related to Dan and Cerberus: insights into the mechanism of bone morphogenetic protein antagonism.Structure. 2013 Aug 6;21(8):1417-29. doi: 10.1016/j.str.2013.06.005. Epub 2013 Jul 11. Structure. 2013. PMID: 23850456 Free PMC article.
References
-
- Hamersma, H., Gardner, J., and Beighton, P. (2003) Clin. Genet. 63 192-197 - PubMed
-
- Brunkow, M. E., Gardner, J. C., Van Ness, J., Paeper, B. W., Kovacevich, B. R., Proll, S., Skonier, J. E., Zhao, L., Sabo, P. J., Fu, Y. H., Alisch, R. S., Gillett, L., Colbert, T., Tacconi, P., Galas, D., Hamersma, H., Beighton, P., and Mulligan, J. T. (2001) Am. J. Hum. Genet. 68 577-589 - PMC - PubMed
-
- Balemans, W., Ebeling, M., Patel, N., Van Hul, E., Olson, P., Dioszegi, M., Lacza, C., Wuyts, W., Van den Ende, J., Willems, P., Paes-Alves, A. F., Hill, S., Bueno, M., Ramos, F. J., Tacconi, P., Dikkers, F. G., Stratakis, C., Lindpaintner, K., Vickery, B., Foernzler, D., and Van Hul, W. (2001) Hum. Mol. Genet. 10 537-543 - PubMed
-
- Li, X., Ominsky, M. S., Niu, Q. T., Sun, N., Daugherty, B., D'Agostin, D., Kurahara, C., Gao, Y., Cao, J., Gong, J., Asuncion, F., Barrero, M., Warmington, K., Dwyer, D., Stolina, M., Morony, S., Sarosi, I., Kostenuik, P. J., Lacey, D. L., Simonet, W. S., Ke, H. Z., and Paszty, C. (2008) J. Bone Miner. Res. 23 860-869 - PubMed
-
- Poole, K. E. S., van Bezooijen, R. L., Loveridge, N., Hamersma, H., Papapoulos, S. E., Lowik, C. W., and Reeve, J. (2005) FASEB J. 19 1842-1844 - PubMed
Publication types
MeSH terms
Substances
Grants and funding
LinkOut - more resources
Full Text Sources
Other Literature Sources
Molecular Biology Databases
