. 2009 Apr;37(6):2003-13.
doi: 10.1093/nar/gkp077. Epub 2009 Feb 10.

Evolutionary Conserved Motif Finder (ECMFinder) for genome-wide identification of clustered YY1- and CTCF-binding sites

Affiliations

Evolutionary Conserved Motif Finder (ECMFinder) for genome-wide identification of clustered YY1- and CTCF-binding sites

Keunsoo Kang et al. Nucleic Acids Res. 2009 Apr.

Abstract

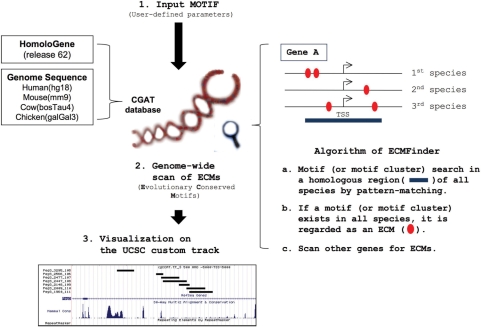
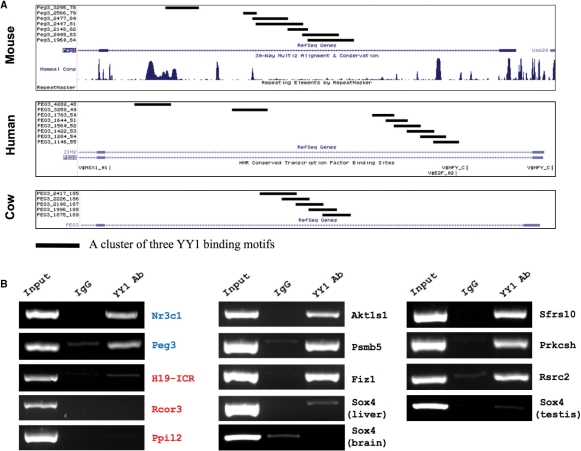
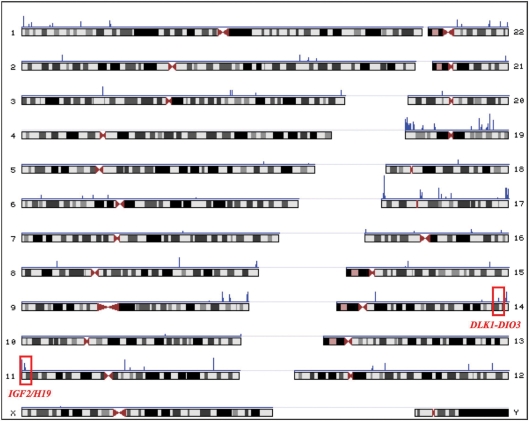
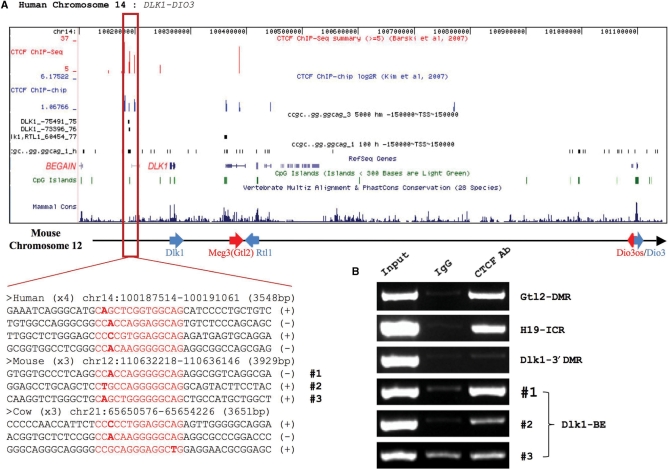
We have developed a new bioinformatics approach called ECMFinder (Evolutionary Conserved Motif Finder). This program searches for a given DNA motif within the entire genome of one species and uses the gene association information of a potential transcription factor-binding site (TFBS) to screen the homologous regions of a second and third species. If multiple species have this potential TFBS in homologous positions, this program recognizes the identified TFBS as an evolutionary conserved motif (ECM). This program outputs a list of ECMs, which can be uploaded as a Custom Track in the UCSC genome browser and can be visualized along with other available data. The feasibility of this approach was tested by searching the genomes of three mammals (human, mouse and cow) with the DNA-binding motifs of YY1 and CTCF. This program successfully identified many clustered YY1- and CTCF-binding sites that are conserved among these species but were previously undetected. In particular, this program identified CTCF-binding sites that are located close to the Dlk1, Magel2 and Cdkn1c imprinted genes. Individual ChIP experiments confirmed the in vivo binding of the YY1 and CTCF proteins to most of these newly discovered binding sites, demonstrating the feasibility and usefulness of ECMFinder.


Figures

Figure 1.
Figure 1.
Overall scheme of ECMFinder. ECMFinder uses the CGAT (Common Gene Annotation Table) database, which is the product of merging homologous gene annotations derived from HomoloGene (release 62) and the genome sequence of four species—human (hg18), mouse (mm9), cow (bosTau4) and chicken (galGal3). Users can define an input motif based on the ECMFinder syntax, which is briefly described in the Readme file of the program (Step 1). ECMFinder searches a user-defined homologous region (dark blue bar) around a gene's TSS for the motif (or motif cluster) in all species. If at least one motif (or motif cluster) exists in the homologous region of all species, they are identified as ECMs (Evolutionary Conserved Motifs, red oval) (Step 2). The output of ECMFinder is a GFF (General Feature Format) file that can be uploaded to the UCSC genome browser as a Custom Track and visualized along with other data sets (Step 3).
Figure 2.
Figure 2.
Visualization and in vivo confirmation of the clustered YY1-binding sites predicted by ECMFinder. (A) Clusters of YY1-binding sites located within the 1st intron of Peg3 were visualized along with other data using the Custom Track. Each cluster of conserved YY1-binding sites detected by ECMFinder is indicated by a thick black line in the top track. The following tracks are provided from the UCSC genome browser (RefSeq for gene annotations, PhastCons for conservation, RepeatMasker for repeat elements, HMR conserved Transcription Factor Binding Sites for predicted TFBSs). In the human box, the HMR (human, mouse and rat) conserved TFBSs method using PWM matrix failed to predict the presence of the YY1-binding sites due to the low conservation level of this region. However, all three species have clustered YY1-binding sites within the 1st intron of Peg3. (B) YY1–ChIP results of candidate genes. This series of YY1–ChIP analysis were performed to confirm the in vivo binding of YY1 to each locus predicted by ECMFinder. The amplified PCR products from each locus are shown in the following order: the Input (lane 1), the IgG lane with rabbit normal serum (lane 2) and the YY1 Ab lane with YY1 antibody (lane 3). The two previously known YY1-binding sites were used as positive controls (Nr3c1 and Peg3, blue), whereas three YY1-unrelated loci were used as negative controls (H19-ICR, the promoter region of Rcor3, and the exon region of Ppil2, red). We tested seven randomly chosen loci out of the 31 predicted YY1 clustered regions, including Akt1s1, Fiz1, Prkcsh, Psmb5, Rsrc2, Sfrs10 and Sox4.
Figure 3.
Figure 3.
Distribution of the identified CTCF ECMs in the human genome. The density of the CTCF ECMs is represented on the UCSC genome graph. All ECMs shown here were confirmed using previously published genome-wide CTCF ChIP-seq data (17) and exact position of each ECM is available as Supplementary Table 3. The blue peak indicates the density of CTCF ECMs identified by ECMFinder. We identified 174 loci with clustered CTCF-binding sites that are conserved between two species (human and mouse). The two imprinted loci with the clustered CTCF-binding sites are indicated by red squares, IGF2/H19 in the chromosome 11 and DLK1-DIO3 in the chromosome 14. Detailed inspection of the clustered CTCF sites identified by ECMFinder is available by browsing the UCSC Custom Track (http://genome.ucsc.edu/cgi-bin/hgTracks?db=hg18&hgt.customText= http://jookimlab.lsu.edu/sites/default/files/ctcf_data.txt).
Figure 4.
Figure 4.
CTCF ECMs in the DLK1-DIO3 domain. (A) Custom Track View of human chromosome 14. The first track shows the density of genome-wide CTCF ChIP-seq data (17). The second track shows the log2 value of genome-wide CTCF ChIP-chip data (13). The third and fourth tracks indicate the CTCF ECMs and CTCF single binding motif detected by ECMFinder, respectively. The remaining tracks have been derived from the UCSC genome browser. The CTCF motifs are conserved although their flanking sequences have degenerated. Each sequence includes a CTCF motif (red) with its immediate surrounding regions (bottom left). The middle section shows the Dlk1-Dio3 domain in mouse chromosome 12. Maternally and paternally expressed genes are indicated by red and blue arrows, respectively. Sequence alignments of individual CTCF-binding sites and their flanking regions are also shown in the bottom left section. (B) ChIP confirmation of the three CTCF sites using mouse liver tissues. The Gtl2-DMR and H19-ICR were used as positive controls, and the Dlk1-3′ DMR was used as a negative control. Individual ChIP results from the three CTCF sites are shown below with their site numbers. (C) The first CTCF-binding site (#1) is well conserved among seven mammalian species (mouse, rat, human, orangutan, dog, horse and opossum). (D) PvuII enzyme digestion of CTCF ChIP–PCR product with an input control. PvuII digests only the paternal DNA (Mus spretus). The upper band is an undigested DNA (300 bp) and the lower band is a 241-bp fragment of DNA digested by PvuII. (E) Results of bisulfite sequencing of the 957-bp region surrounding the CTCF site #1. The closed and open circles indicate methylated and unmethylated CpGs, respectively. The red triangle represents the position of the CTCF site #1. The bisulfite sequencing results were further separated based on parental origin indicated by sex symbols and species names.
Figure 4.
Figure 4.
CTCF ECMs in the DLK1-DIO3 domain. (A) Custom Track View of human chromosome 14. The first track shows the density of genome-wide CTCF ChIP-seq data (17). The second track shows the log2 value of genome-wide CTCF ChIP-chip data (13). The third and fourth tracks indicate the CTCF ECMs and CTCF single binding motif detected by ECMFinder, respectively. The remaining tracks have been derived from the UCSC genome browser. The CTCF motifs are conserved although their flanking sequences have degenerated. Each sequence includes a CTCF motif (red) with its immediate surrounding regions (bottom left). The middle section shows the Dlk1-Dio3 domain in mouse chromosome 12. Maternally and paternally expressed genes are indicated by red and blue arrows, respectively. Sequence alignments of individual CTCF-binding sites and their flanking regions are also shown in the bottom left section. (B) ChIP confirmation of the three CTCF sites using mouse liver tissues. The Gtl2-DMR and H19-ICR were used as positive controls, and the Dlk1-3′ DMR was used as a negative control. Individual ChIP results from the three CTCF sites are shown below with their site numbers. (C) The first CTCF-binding site (#1) is well conserved among seven mammalian species (mouse, rat, human, orangutan, dog, horse and opossum). (D) PvuII enzyme digestion of CTCF ChIP–PCR product with an input control. PvuII digests only the paternal DNA (Mus spretus). The upper band is an undigested DNA (300 bp) and the lower band is a 241-bp fragment of DNA digested by PvuII. (E) Results of bisulfite sequencing of the 957-bp region surrounding the CTCF site #1. The closed and open circles indicate methylated and unmethylated CpGs, respectively. The red triangle represents the position of the CTCF site #1. The bisulfite sequencing results were further separated based on parental origin indicated by sex symbols and species names.

Similar articles

Cited by

References

    1. Ludwig MZ. Functional evolution of noncoding DNA. Curr. Opin. Genet. Dev. 2002;12:634–639. - PubMed
    1. Bulyk ML. Computational prediction of transcription-factor binding site locations. Genome Biol. 2003;5:201. - PMC - PubMed
    1. GuhaThakurta D. Computational identification of transcriptional regulatory elements in DNA sequence. Nucleic Acids Res. 2006;34:3585–3598. - PMC - PubMed
    1. Visel A, Bristow J, Pennacchio LA. Enhancer identification through comparative genomics. Semin. Cell Dev. Biol. 2007;18:140–152. - PMC - PubMed
    1. Blanchette M, Bataille AR, Chen X, Poitras C, Laganière J, Lefèbvre C, Deblois G, Giguère V, Ferretti V, Bergeron D, et al. Genome-wide computational prediction of transcriptional regulatory modules reveals new insights into human gene expression. Genome Res. 2006;16:656–668. - PMC - PubMed

Publication types