. 2009 Feb;7(2):157-67.
doi: 10.1158/1541-7786.MCR-08-0435. Epub 2009 Feb 10.

Rembrandt: helping personalized medicine become a reality through integrative translational research

Affiliations

Rembrandt: helping personalized medicine become a reality through integrative translational research

Subha Madhavan et al. Mol Cancer Res. 2009 Feb.

Abstract

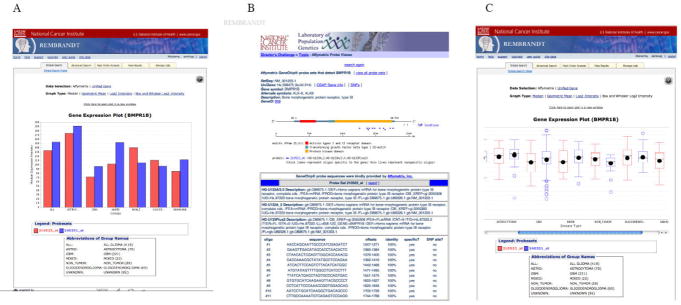
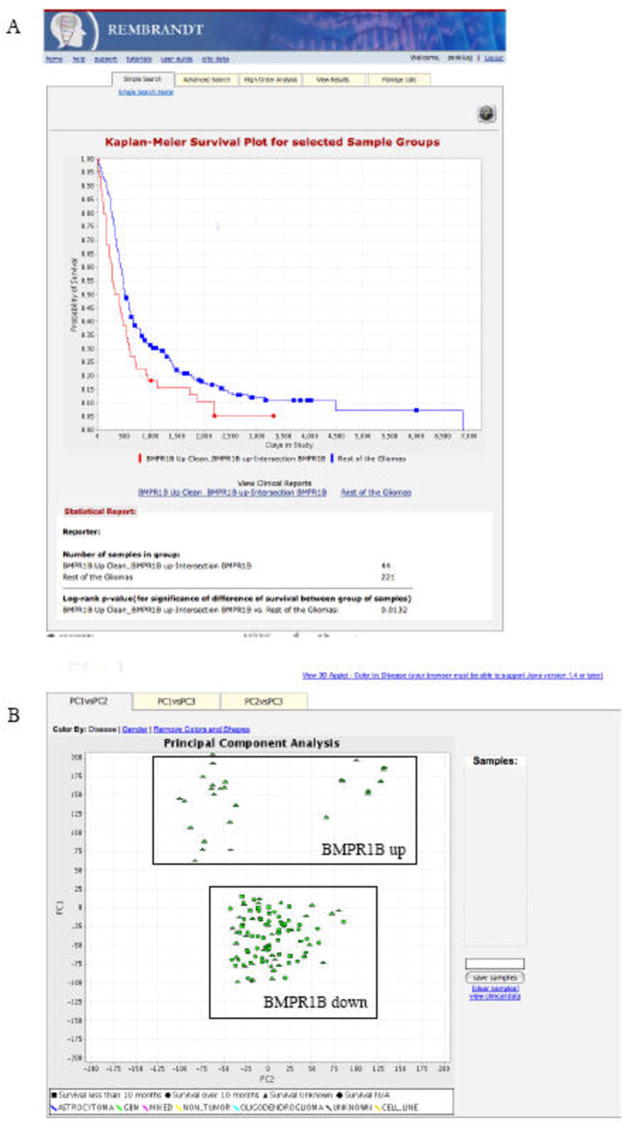
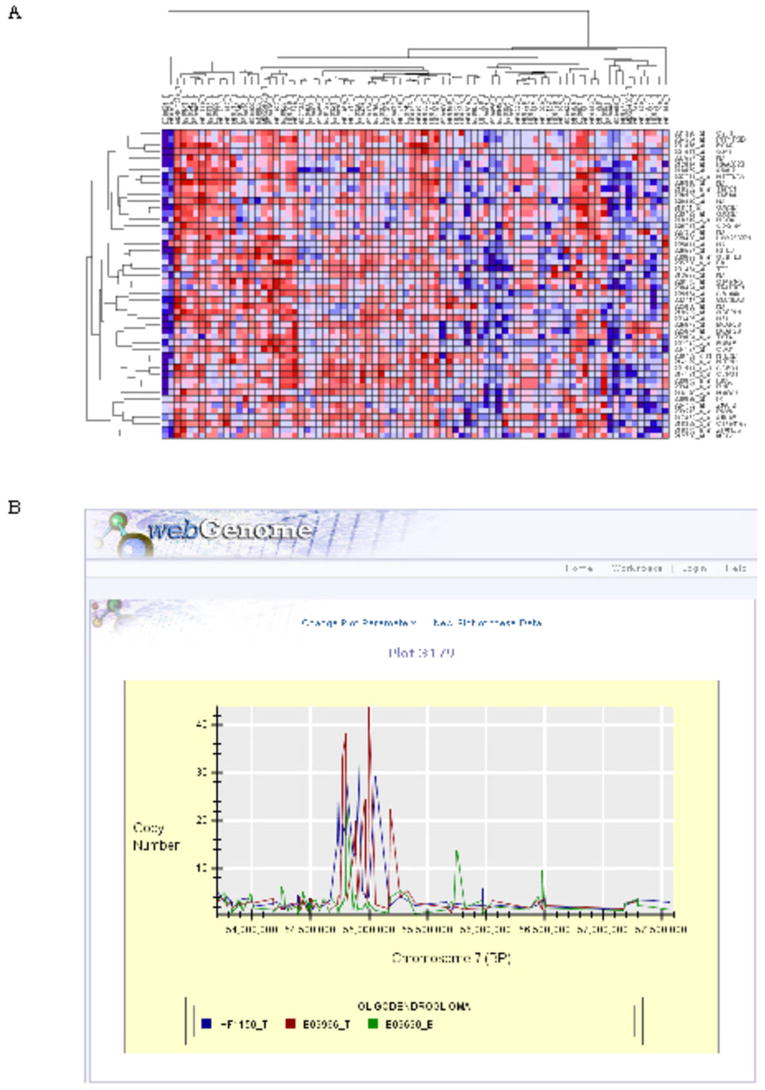
Finding better therapies for the treatment of brain tumors is hampered by the lack of consistently obtained molecular data in a large sample set and the ability to integrate biomedical data from disparate sources enabling translation of therapies from bench to bedside. Hence, a critical factor in the advancement of biomedical research and clinical translation is the ease with which data can be integrated, redistributed, and analyzed both within and across functional domains. Novel biomedical informatics infrastructure and tools are essential for developing individualized patient treatment based on the specific genomic signatures in each patient's tumor. Here, we present Repository of Molecular Brain Neoplasia Data (Rembrandt), a cancer clinical genomics database and a Web-based data mining and analysis platform aimed at facilitating discovery by connecting the dots between clinical information and genomic characterization data. To date, Rembrandt contains data generated through the Glioma Molecular Diagnostic Initiative from 874 glioma specimens comprising approximately 566 gene expression arrays, 834 copy number arrays, and 13,472 clinical phenotype data points. Data can be queried and visualized for a selected gene across all data platforms or for multiple genes in a selected platform. Additionally, gene sets can be limited to clinically important annotations including secreted, kinase, membrane, and known gene-anomaly pairs to facilitate the discovery of novel biomarkers and therapeutic targets. We believe that Rembrandt represents a prototype of how high-throughput genomic and clinical data can be integrated in a way that will allow expeditious and efficient translation of laboratory discoveries to the clinic.


Figures

Figure 1
Figure 1
Data integration via the Rembrandt discovery platform
Figure 2
Figure 2
A) Gene expression box plot for BMPR1B. Samples are shown categorized by histological type. Different Affymetrix probesets are shown as different color bars. B) BMPR1B probeset in Affymetrix probeset viewer. Information for selected probeset can be displayed, allowing the user to decide on the quality of information retrieved. C) BMPR1B probeset of interest showing outliers in GBM samples. The ability to display expression graphs in different formats allow the use to gain a wealth of information without having to redo the queries.
Figure 3
Figure 3
A) K-M survival plot showing survival comparing BMRP1-upregulating samples and rest of the gliomas in the database. This plot allows you to identify putative clinically relevant genes to explore as new targets for therapy. Users can query gene expression and graph changes in survival rate at each time point on the study. Kaplan-Meier (K-M) estimates are calculated based on the last follow-up time and the censor status (0=alive, 1=dead) from the samples of interest. The Kaplan-Meier estimates are then plotted against the survival time. Users can dynamically modify the fold change (up and down regulation) thresholds and redraw the plot. A log-rank p-value is provided as an indication of significance of the difference in survival between any two groups of samples segregated based on gene expression of the gene of interest. B) Performing principal component analysis and correlating with clinical data. This figure shows an example Principal Component Analysis report from the REMBRANDT application. This two-dimensional (a) and three-dimensional graph plots (b) the various principal components from the gene expression PCA analysis. Various analysis options are provided to the user to select from an array of gene/reporter filtering and sample selection settings. Users can select samples in the 2-dimensional plot to retrieve related clinical information on the selected patients.
Figure 4
Figure 4
A) Heatmap view in GenePattern. Subsets of data from Rembrandt can be transferred to GenePattern using standard interfaces to invoke a number of run-time data analysis capabilities. A heatmap for 50 neighbors of SCF is shown for astrocytoma and mixed glioma samples in Rembrandt. B) Scatter plot for copy number data across physical genomic locations. Scatter plots (shown above) display measured copy number against physical genome location in an application called webGenome, which has been integrated with Rembrandt via standard data interfaces. These plots are context-sensitive to the copy number reports generated from the copy number queries in the caIntegrator application. You can view data at arbitrary resolutions from the entire genome on down.
Figure 4
Figure 4
A) Heatmap view in GenePattern. Subsets of data from Rembrandt can be transferred to GenePattern using standard interfaces to invoke a number of run-time data analysis capabilities. A heatmap for 50 neighbors of SCF is shown for astrocytoma and mixed glioma samples in Rembrandt. B) Scatter plot for copy number data across physical genomic locations. Scatter plots (shown above) display measured copy number against physical genome location in an application called webGenome, which has been integrated with Rembrandt via standard data interfaces. These plots are context-sensitive to the copy number reports generated from the copy number queries in the caIntegrator application. You can view data at arbitrary resolutions from the entire genome on down.
Figure 5
Figure 5
User-friendly data query interface. Query pages enable users to restrict their searches in the database to specific genomic and/or clinical criteria.
Figure 6
Figure 6
Gene Expression Fold Report. All reports in Rembrandt are fully customizable at the report window, making unnecessary to re-run queries to refine the results.

References

    1. Cancer Statistics Branch N, NIH. Cancer Survival rates. In: Harras A, editor. Cancer: Rates & Risks. Washington, DC: US Dept of Health & Human Services, National Institutes of Health; 1996. pp. 28–34.
    1. Nutt CL, Mani DR, Betensky RA, et al. Gene expression-based classification of malignant gliomas correlates better with survival than histological classification. Cancer Res. 2003;63:1602–7. - PubMed
    1. Mischel PS, Shai R, Shi T, et al. Identification of molecular subtypes of glioblastoma by gene expression profiling. Oncogene. 2003;22:2361–73. - PubMed
    1. Phillips HS, Kharbanda S, Chen R, et al. Molecular subclasses of high-grade glioma predict prognosis, delineate a pattern of disease progression, and resemble stages in neurogenesis. Cancer Cell. 2006;9:157–73. - PubMed
    1. Nigro JM, Misra A, Zhang L, et al. Integrated array-comparative genomic hybridization and expression array profiles identify clinically relevant molecular subtypes of glioblastoma. Cancer Res. 2005;65:1678–86. - PubMed

Publication types