. 2009 Mar 1;122(Pt 5):687-95.
doi: 10.1242/jcs.032102. Epub 2009 Feb 10.

Apical membrane maturation and cellular rosette formation during morphogenesis of the zebrafish lateral line

Affiliations

Apical membrane maturation and cellular rosette formation during morphogenesis of the zebrafish lateral line

David Hava et al. J Cell Sci. .

Abstract

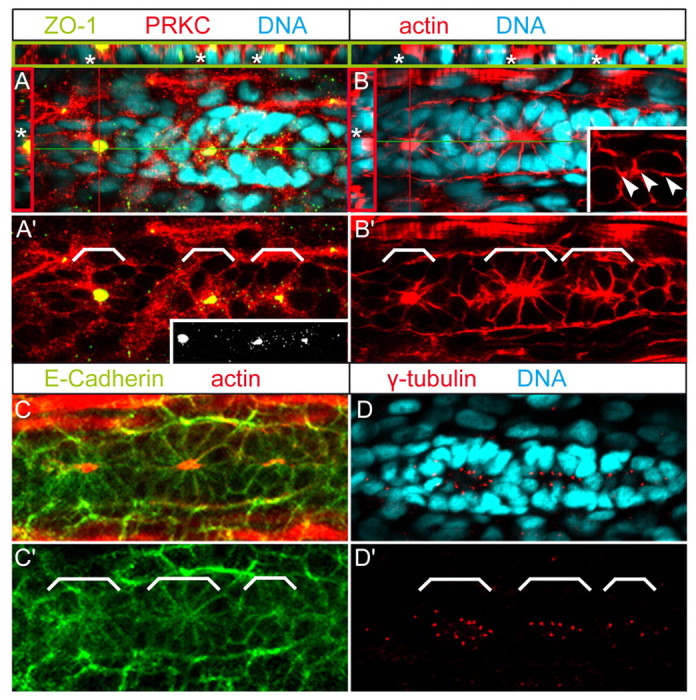
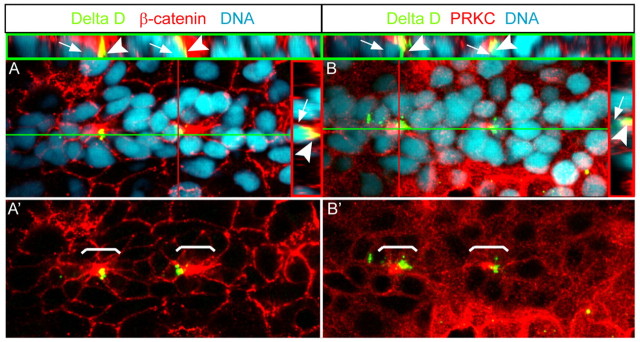
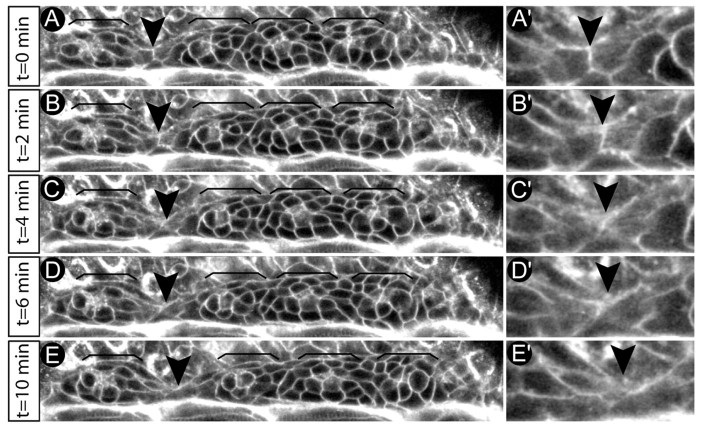
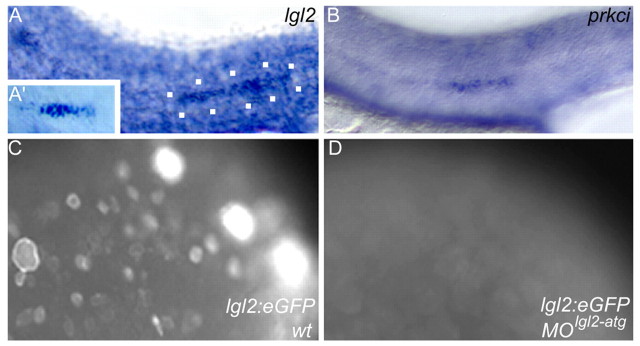
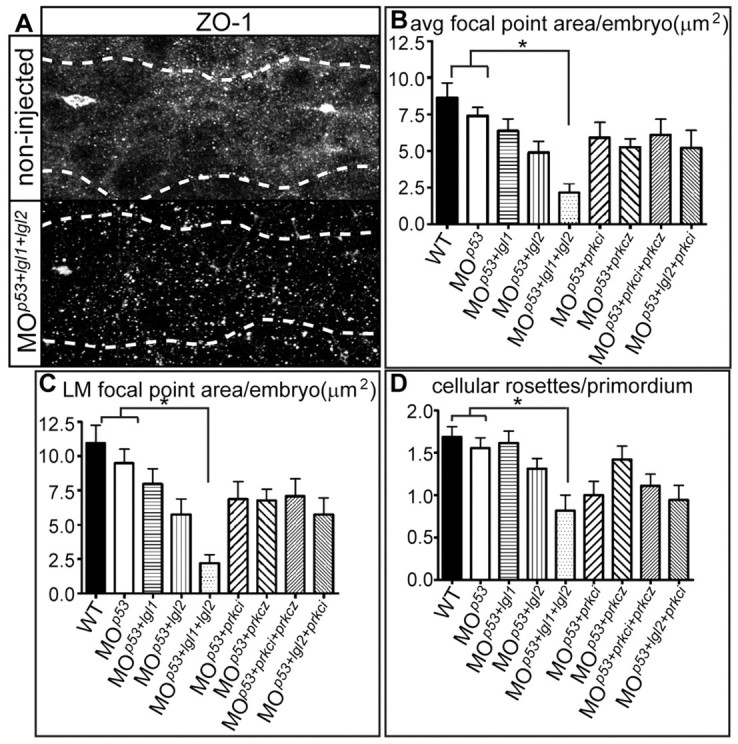
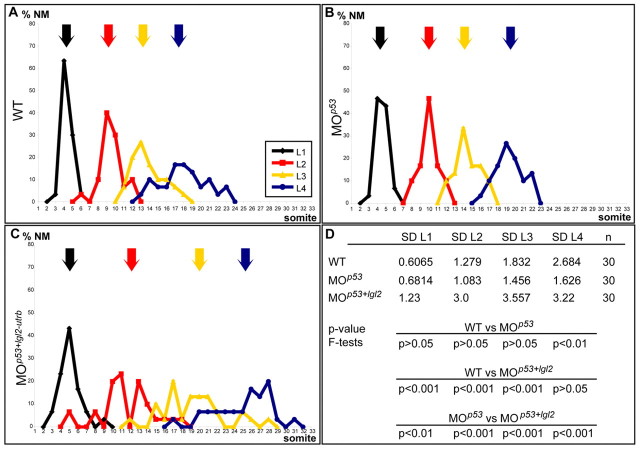
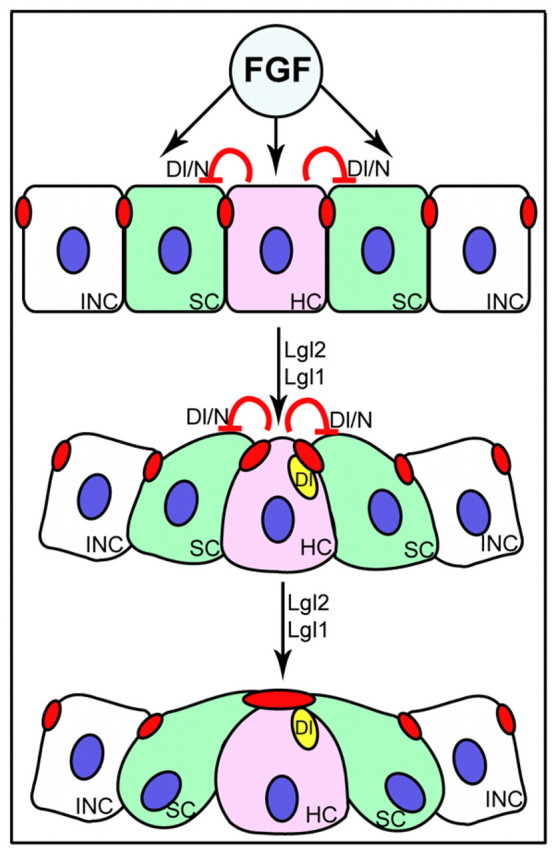
Tissue morphogenesis and cell sorting are major forces during organ development. Here, we characterize the process of tissue morphogenesis within the zebrafish lateral line primordium, a migratory sheet of cells that gives rise to the neuromasts of the posterior lateral line organ. We find that cells within this epithelial tissue constrict actin-rich membranes and enrich apical junction proteins at apical focal points. The coordinated apical membrane constriction in single Delta D-positive hair cell progenitors and in their neighbouring prospective support cells generates cellular rosettes. Live imaging reveals that cellular rosettes subsequently separate from each other and give rise to individual neuromasts. Genetic analysis uncovers an involvement of Lethal giant larvae proteins in the maturation of apical junction belts during cellular rosette formation. Our findings suggest that apical constriction of cell membranes spatially confines regions of strong cell-cell adhesion and restricts the number of tightly interconnected cells into cellular rosettes, which ensures the correct deposition of neuromasts during morphogenesis of the posterior lateral line organ.


Figures

Fig. 1.
Fig. 1.
Epithelial organization and apical membrane constriction during PLLP rosette formation. Epithelial organization of PLLP cells was assayed by immunohistochemistry. Shown are reconstructions of confocal images of the PLLP at 36 hpf. (A,B) Asterisks indicate nuclei of deep cells underlying apical focal points. Red lines indicate cross-section planes, green lines indicate sagittal section planes, and the respective sections are shown within red (apical towards the left) or green insets (apical towards the top). White brackets indicate positions of individual rosettes. Cross- and sagittal sections reveal that ZO1- and actin-rich constrictions are apical, and that single presumptive hair cells are below the plane of the epithelial layer (recognized by the deep nuclear staining). Inset in A′ depicts ZO1, which localizes to apical focal points but is not detectable along other cell membranes, including the leading edge region. (B) White inset shows details of the leading edge region, which contains apical actin spots along anterior-posterior interfaces (white arrowheads). Dynamic apical constriction of actin and apical ZO1 localization occur in a leading to trailing edge direction. (C,C′) E-Cadherin does not cluster within apical constrictions. (D) Centrosomes are arranged closely around apical constrictions. White brackets indicate positions of individual rosettes.
Fig. 2.
Fig. 2.
Apical membrane constriction corresponds with Delta/Notch-mediated hair cell progenitor specification. Epithelial organization of PLLP cells, as assayed by immunohistochemistry. Shown are reconstructions of confocal images of the PLLP at 36 hpf. Red lines indicate cross-section planes, green lines indicate sagittal section planes and the respective sections are shown within red (apical to the right) or green insets (apical to the top). White brackets in A′ and B′ indicate position of individual rosettes. Individual rosettes contain apical (A) β-catenin- and (B) PRKC-rich apical focal points that are associated with Delta D. White arrowheads (red and green insets) indicate Delta D-positive aggregates that are associated with apical constrictions but extend more basolaterally towards the nuclei of the deep hair progenitor cells (white arrows).
Fig. 3.
Fig. 3.
Dynamics of neuromast deposition. (A-E′) Shown is the process of neuromast deposition within a wild-type embryo that was labelled with the vital membrane marker BODIPY ceramide and followed over a 10-minute period by time-lapse analysis. Rosettes are indicated by brackets and the plane of tissue separation is indicated by arrowheads. (A′-E′) Details of cellular cell shape changes along the plane of tissue separation indicate that cells surrounding individual rosettes are extensively elongated and that tissue separation occurs exclusively in between interneuromast cells, leaving individual rosettes intact. Therefore, rosettes, including their surrounding cells, are units of tissue separation.
Fig. 4.
Fig. 4.
lgl2 and prkci expression within the posterior lateral line. (A,B) Expression of lgl2 and prkci within the PLLP at 28-32 hpf (PLLP outlined with white dots) and (A′) lgl2 expression within the secondary primordium of the lateral line organ at 48 hpf. (C) Injection of a reporter plasmid expressing Lgl2::eGFP results in strong protein expression during gastrula stages in wild type but (D) is efficiently blocked in MOlgl2-atg injected animals.
Fig. 5.
Fig. 5.
Apical focal point area is affected by Lgl2 and Lgl1. (A) Apical focal points and the migrating PLLP (outlined by white dots) were visualized by immunohistochemistry using an antibody against ZO1 as well as rhodamine-phalloidin (not shown) in wild-type and MOp53/MOlgl2-utrb/MOlgl1-injected 34 hpf embryos. MOp53 was co-injected to minimize off-target effects. (B,C) The size of ZO1-positive areas was analyzed quantitatively. Both the averaged total focal point area and the area of the left-most (LM) proximal focal point are significantly reduced (considered to be significant if P<0.05) in MOp53/MOlgl2-utrb/MOlgl1-injected morphants when compared with wild-type or MOp53-injected morphants (P<0.001 compared with wild type and P<0.01 compared with MOp53). (D) The average number of cellular rosettes/PLLP. The number of rosettes is strongly reduced in MOp53/MOlgl2-utrb/MOlgl1 morphant embryos compared with wild-type or MOp53 morphants. The following number of embryos was analyzed: wild type, n=16; MOp53, n=18; MOp53/MOlgl1, n=13; MOp53/MOlgl2-utrb, n=16; MOp53/MOlgl2-utrb/MOlgl1, n=11; MOp53/MOprkci, n=20; MOp53/MOprkcz, n=19; MOp53/MOprkci/MOprkcz, n=18; MOp53/MOlgl2-utrb/MOprkci, n=18. Error bars indicate s.e.m.
Fig. 6.
Fig. 6.
Distribution of the first four neuromast positions is affected by loss of Lgl2. Schematic representation of the distribution of the first four neuromast positions, L1-L4, in (A) wild-type, (B) MOp53- and (C) MOp53/MOlgl2-utrb-injected embryos at 48 hpf. The arrows indicate the mean positions of L1-L4 based on the following calculated means: (A) wild type (n=30): L1, 4.333; L2, 9.533; L3, 13.766; L4, 17,966; (B) MOp53 (n=30): L1, 4.533; L2, 10.000; L3, 14.466; L4, 19.333; (C) MOp53/MOlgl2-utrb (n=30): L1, 5.066; L2, 11.633; L3, 19.366; L4, 25.1. (D) The standard deviation (s.d.) of each population from these means is provided, as well as the P values of the F-test performed to determine whether any difference in the s.d. is statistically significant (considered to be the case if P<0.05). The spread of the distribution of the mean position is significantly wider for each of the first four neuromasts in MOp53/MOlgl2-utrb-injected embryos when compared with MOp53-injected embryos.
Fig. 7.
Fig. 7.
Apical membrane constriction and rosette formation is affected by antagonistic activities of Lgl2 and PRKCi. Epithelial organization of PLLP cells was assayed by immunohistochemistry. Shown are reconstructions of confocal images of the PLLP at 36 hpf. (A-F) The number of rosettes (white brackets) is strongly reduced within different backgrounds. (E′) Instead, the central region of the PLLP frequently contains actin-rich spots that are indicative of incomplete apical constriction (white asterisks). (F) Loss of ZO1 expression within severely affected PLLPs that fail to produce rosettes. There is mosaic and strong ectopic expression of PRKCiKD upon overexpression of the corresponding mRNA. (G) Schematic diagram of tissue separation within the PLLP. Red indicates the distribution of actin-rich apical membranes that are widely present within the leading edge region of the PLLP (green cells, region I) and confined to apical focal points within rosettes (light red cells, region II; regions indicated by broken line), which are surrounded by interneuromast cells (white cells). In lgl2S5A or prkciKD mutants, the process of rosette formation is delayed. Brackets indicate presumptive neuromasts and black arrowheads indicate future points of tissue separation. The direction of PLLP migration is indicated by a black arrow.
Fig. 8.
Fig. 8.
Possible scenario illustrating the process of rosette formation. FGF signalling most probably links tissue morphogenesis regulated by Lgl2 and Lgl1 with the Dl/N interaction involved in hair cell specification. Delta/Notch activity (Dl/N) singles out a Delta D-positive hair cell progenitor (HC, pink) among a group of presumptive support cells (SC, green). Delta D-positive aggregates (yellow ovals) associate with but do not colocalize with actin-rich adhesion complexes (red ovals). Each rosette is surrounded by a group of interneuromast cells (INC, white) that do not undergo apical clustering. Activity of the cell polarity regulators Lgl2 and Lgl1 is required for maturation of apical junctions.

Similar articles

Cited by

References

    1. Betschinger, J., Mechtler, K. and Knoblich, J. A. (2003). The Par complex directs asymmetric cell division by phosphorylating the cytoskeletal protein Lgl. Nature 422, 326-330. - PubMed
    1. Betschinger, J., Eisenhaber, F. and Knoblich, J. A. (2005). Phosphorylation-induced autoinhibition regulates the cytoskeletal protein Lethal (2) giant larvae. Curr. Biol. 15, 276-282. - PubMed
    1. Blankenship, J. T., Backovic, S. T., Sanny, J. S., Weitz, O. and Zallen, J. A. (2006). Multicellular rosette formation links planar cell polarity to tissue morphogenesis. Dev. Cell 11, 459-470. - PubMed
    1. Brown, K. E., Baonza, A. and Freeman, M. (2006). Epithelial cell adhesion in the developing Drosophila retina is regulated by Atonal and the EGF receptor pathway. Dev. Biol. 300, 710-721. - PubMed
    1. Cooper, M. S., D'Amico, L. A. and Henry, C. A. (1999). Confocal microscopic analysis of morphogenetic movements. Methods Cell Biol. 59, 179-204. - PubMed

Publication types

MeSH terms