. 2009 Feb 10;7(2):e32.
doi: 10.1371/journal.pbio.1000032.

The interscutularis muscle connectome

Affiliations

The interscutularis muscle connectome

Ju Lu et al. PLoS Biol. .

Erratum in

  • PLoS Biol. 2009 Apr;7(4):e1000108

Abstract

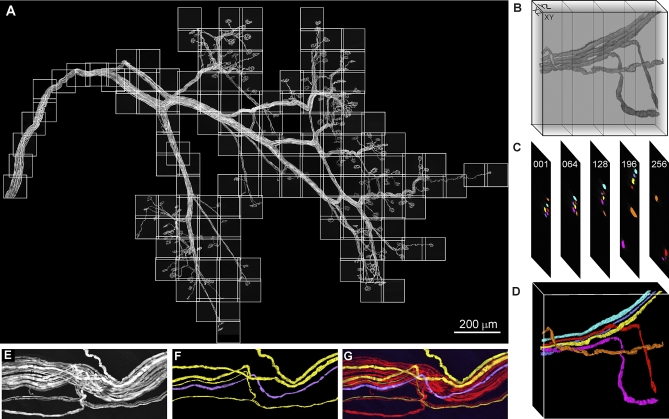
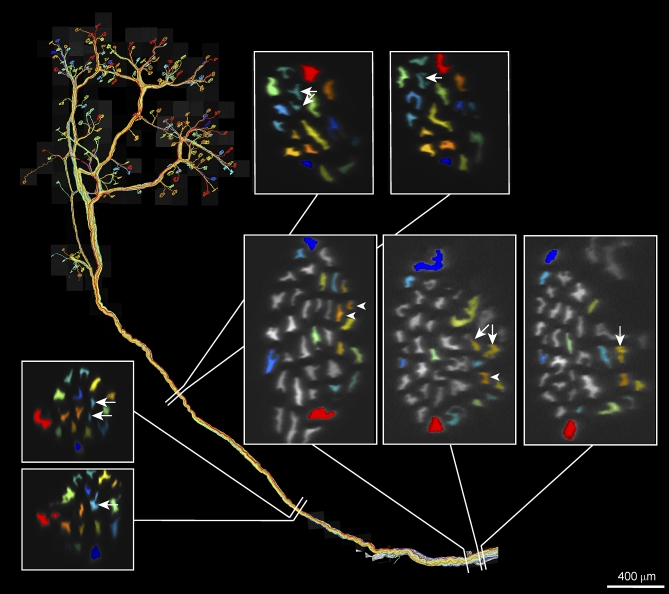
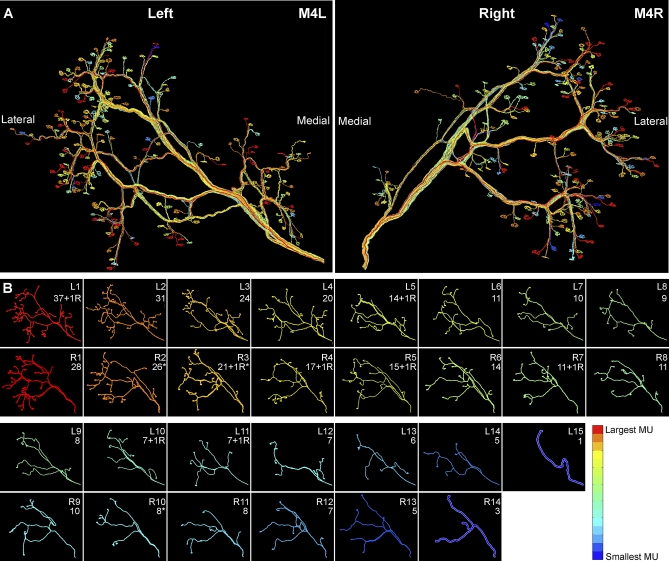
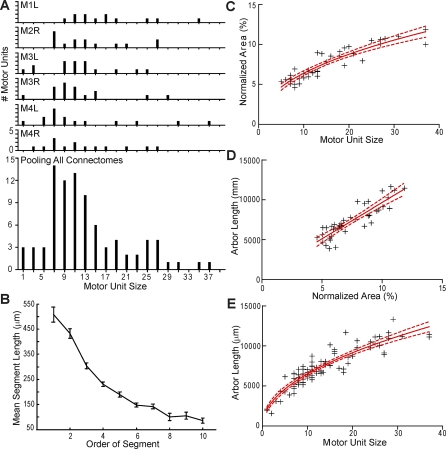
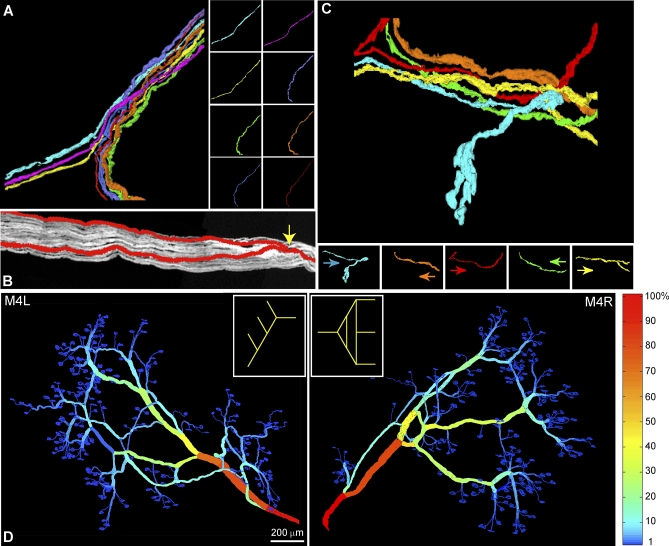
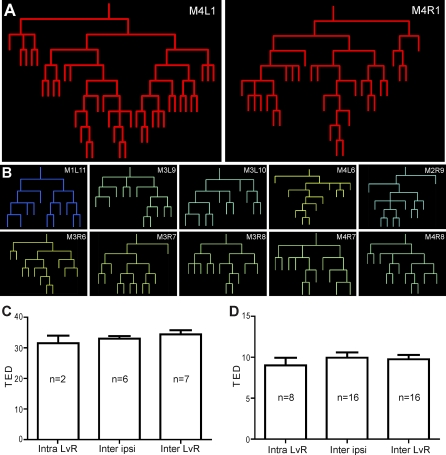
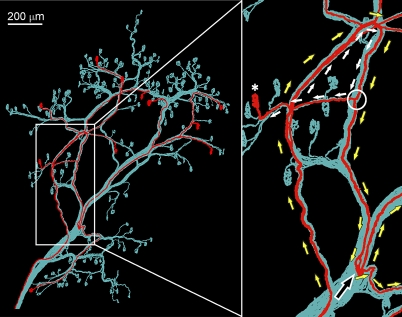
The complete connectional map (connectome) of a neural circuit is essential for understanding its structure and function. Such maps have only been obtained in Caenorhabditis elegans. As an attempt at solving mammalian circuits, we reconstructed the connectomes of six interscutularis muscles from adult transgenic mice expressing fluorescent proteins in all motor axons. The reconstruction revealed several organizational principles of the neuromuscular circuit. First, the connectomes demonstrate the anatomical basis of the graded tensions in the size principle. Second, they reveal a robust quantitative relationship between axonal caliber, length, and synapse number. Third, they permit a direct comparison of the same neuron on the left and right sides of the same vertebrate animal, and reveal significant structural variations among such neurons, which contrast with the stereotypy of identified neurons in invertebrates. Finally, the wiring length of axons is often longer than necessary, contrary to the widely held view that neural wiring length should be minimized. These results show that mammalian muscle function is implemented with a variety of wiring diagrams that share certain global features but differ substantially in anatomical form. This variability may arise from the dominant role of synaptic competition in establishing the final circuit.


Conflict of interest statement

Competing interests. The authors have declared that no competing interests exist.

Figures

Figure 1
Figure 1. Method for Reconstructing Neuromuscular Connectomes
(A) All the axons (labeled with YFP) in an interscutularis muscle were imaged by confocal microscopy with motorized stage. A montage of 146 overlapping image stacks (white squares) provided the dataset (total ∼43 GB) for connectome reconstruction. (B–D) Each XY stack (B) was digitally resampled along an orthogonal axis (x or y) so that most axons could be followed in cross-sections (C). Axonal contours in cross-sections were delineated, color-coded, and rendered in 3D (D) using semi-automatic tracing software. (E–G) Reconstruction accuracy was tested by tracing motor axons in a muscle from a triple transgenic mouse in which all axons expressed an orange fluorescent protein (KOFP) and a small subset of axons expressed in addition either CFP or YFP. (E) Appearance of the nerve in the KOFP channel. From an adjacent section we selected several doubly labeled axons and reconstructed them in this volume using the KOFP channel only. (F) Monochromatic reconstruction results for doubly labeled axons. Lavender, KOFP + CFP; yellow, KOFP + YFP. (G) All three fluorescent channels shown for the volume. The results were identical for the doubly labeled axons (compare [F] and [G]).
Figure 2
Figure 2. Extramuscular Branching of Motor Axons Projecting to the Interscutularis Muscle
All axons innervating sample M4R were reconstructed and color-coded according to their motor unit sizes (see Figure 3). Axons shown in grey projected to other muscles and did not innervate the interscutularis muscle. White boxes show the nerve's cross section just before and just after each of the four instances of axonal bifurcation (arrows and arrowheads show the branching axon).
Figure 3
Figure 3. Connectomes of a Left-Right Pair of Interscutularis Muscles
(A) Axons in the connectomes of the left (L) and right (R) interscutularis muscles of a 1-mo-old animal (M4) were color-coded based on the rank-order of their motor unit sizes in each connectome. (B) Comparison of the branching pattern of each axon with its contralateral counterpart from the largest (L1 and R1) to the smallest (L15, R14). Axons in M4R were flipped horizontally to facilitate visual comparison. Lower numbers in each panel indicate motor unit sizes. R, retraction bulb; *, one NMJ co-innervated by two axons.
Figure 4
Figure 4. Common Features Exhibited by All Connectomes
(A) Motor unit size distribution in each muscle was skewed towards smaller motor units, in agreement with previous physiological data (see text). (B) Mean axonal segment length decreased as segment order increased (71 axons from five muscles, see Figure S3 for more details). Error bars, standard error of the mean (SEM). (C) Normalized axonal cross-sectional area A scaled as the square root of motor unit size M (AM 0.4544, 95% CI of slope: 0.3903–0.5185, R 2 = 0.8445; n = 40). In (C–E) red solid lines are best fitting; red dotted lines show 95% CI. (D) Axonal arbor length L scaled linearly with A (R 2 = 0.7775; n = 40). (E) L scaled as the square root of M (LM 0.4938, 95% CI of slope: 0.4428–0.5447, R 2 = 0.8394; n = 87).
Figure 5
Figure 5. Nerve Fasciculation Pattern and Its Relationship to Axonal Branching
(A) A nerve fascicle branched while its constituent axons did not branch. (B) An axon branched within a nerve fascicle. The two resultant branches continued in parallel in the same nerve. (C) Five axonal branches traveled in opposite directions in the same nerve fascicle. Arrows indicate the proximal-distal direction of each branch. (D) Nerve fasciculation patterns were not symmetrical in the left-right pair of muscles. Each nerve fascicle was color-coded according to its innervation weight, which was defined as the percentage of a muscle's NMJs innervated by axonal branches traveling through the fascicle. Insets: a skeleton of these two connectomes (M4L and M4R) were obtained by removing all fascicles with weights less than 10%. The topologies of the two skeletons were different. For example, there were no loops in M4L but two loops in M4R.
Figure 6
Figure 6. Topological Variability among Corresponding Axons
(A) The largest motor units (M4L1 and M4R1), shown as dendrograms, exhibited different topological structures. (B) Ten motor units with identical motor unit size (11 NMJs) from six muscles all had different topologies. The color differences between panels indicate that these axons ranked slightly differently in their respective connectomes. (C) TED between the largest motor units in six muscles was not significantly different among the three groups: intra-animal left versus right pairs, inter-nimal ipsi-lateral (left-left or right-right) pairs, and interanimal left versus right pairs (one-way ANOVA, p = 0.45). (D) TED between medium-sized axons with the same motor unit size (n = 11 NMJ) in six muscles was not significantly different among the same three groups (one-way ANOVA, p = 0.67). Error bars: standard deviation.
Figure 7
Figure 7. Suboptimality of Wiring Length of Individual Axons
Wiring of a motor axon (red, M4L6, see Figure 3B) was superimposed on the nerve fascicles (blue) of the entire muscle. (Right) The axon took a long detour (yellow arrows) even though a much shorter path existed (black arrow). In addition it did not directly branch to innervate the NMJ to the left (*) but only reached it after looping back (white arrows) and bifurcating at the white circle. This kind of suboptimality in wiring length was observed in almost all connectomes.

Comment in

References

    1. Ramon y Cajal S. In: Histology of the nervous system of man and vertebrates. Swanson N, Swanson LW, editors. New York: Oxford University Press; 1995. translators.
    1. White JG, Southgate E, Thomson JN, Brenner S. The structure of the nervous system of the nematode Caenorhabditis elegans . Phil Trans R Soc Lond B. 1986;314:1–340. - PubMed
    1. Binzegger T, Douglas RJ, Martin KA. A quantitative map of the circuit of cat primary visual cortex. J Neurosci. 2004;24:8441–8453. - PMC - PubMed
    1. Traub RD, Contreras D, Cunningham MO, Murray H, LeBeau FE, et al. Single-column thalamocortical network model exhibiting gamma oscillations, sleep spindles, and epileptogenic bursts. J Neurophysiol. 2005;93:2194–2232. - PubMed
    1. Stepanyants A, Chklovskii DB. Neurogeometry and potential synaptic connectivity. Trends Neurosci. 2005;28:387–394. - PubMed

Publication types