

Medial gastrocnemius myoelectric control of a robotic ankle exoskeleton
- PMID: 19211321
- PMCID: PMC2819404
- DOI: 10.1109/TNSRE.2008.2008285
Medial gastrocnemius myoelectric control of a robotic ankle exoskeleton
Abstract
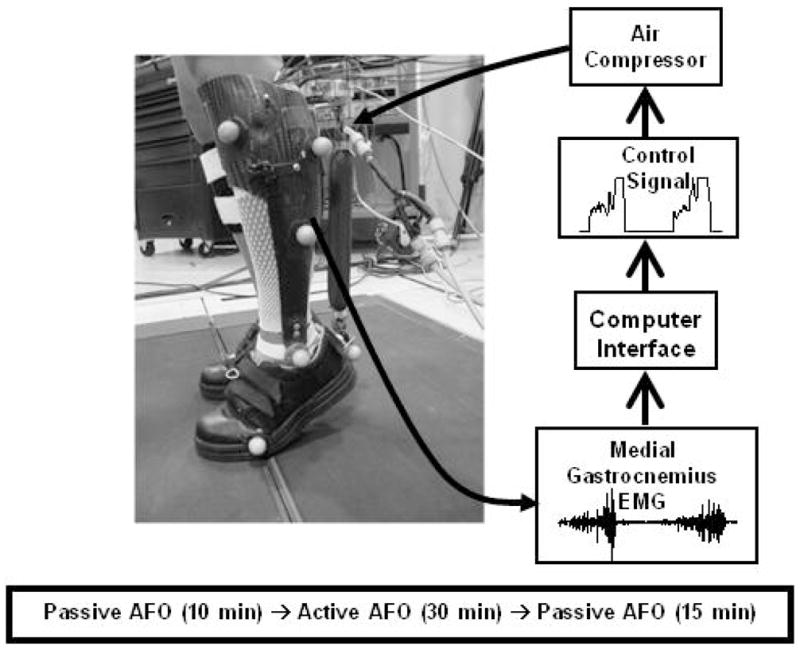
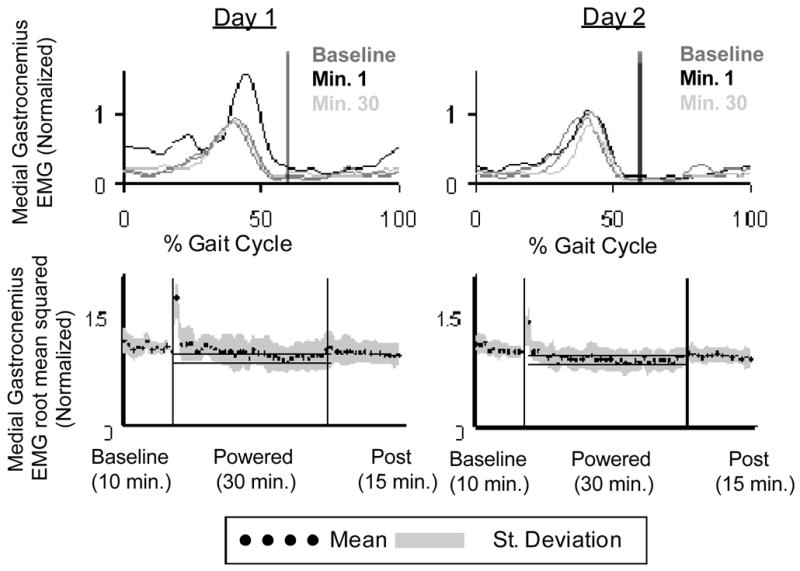
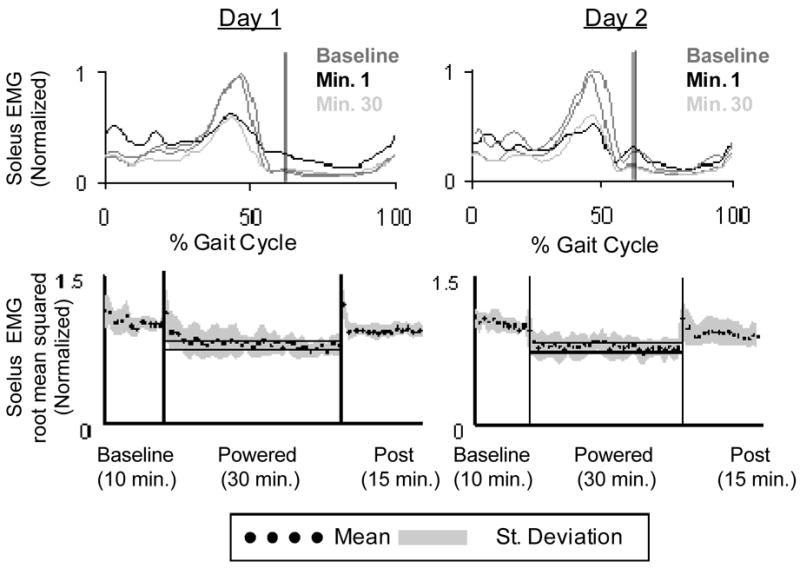
A previous study from our laboratory showed that when soleus electromyography was used to control the amount of plantar flexion assistance from a robotic ankle exoskeleton, subjects significantly reduced their soleus activity to quickly return to normal gait kinematics. We speculated that subjects were primarily responding to the local mechanical assistance of the exoskeleton rather than directly attempting to reduce exoskeleton mechanical power via decreases in soleus activity. To test this observation we studied ten healthy subjects walking on a treadmill at 1.25 m/s while wearing a robotic exoskeleton proportionally controlled by medial gastrocnemius activation. We hypothesized that subjects would primarily decrease soleus activity due to its synergistic mechanics with the exoskeleton. Subjects decreased medial gastrocnemius recruitment by 12% ( p < 0.05 ) but decreased soleus recruitment by 27% ( p < 0.05). In agreement with our hypothesis, the primary reduction in muscle activity was not for the control muscle (medial gastrocnemius) but for the anatomical synergist to the exoskeleton (soleus). These findings indicate that anatomical morphology needs to be considered carefully when designing software and hardware for robotic exoskeletons.
Figures
Similar articles
-
Short-term locomotor adaptation to a robotic ankle exoskeleton does not alter soleus Hoffmann reflex amplitude.J Neuroeng Rehabil. 2010 Jul 26;7:33. doi: 10.1186/1743-0003-7-33. J Neuroeng Rehabil. 2010. PMID: 20659331 Free PMC article.
-
Learning to walk with an adaptive gain proportional myoelectric controller for a robotic ankle exoskeleton.J Neuroeng Rehabil. 2015 Nov 4;12:97. doi: 10.1186/s12984-015-0086-5. J Neuroeng Rehabil. 2015. PMID: 26536868 Free PMC article.
-
Learning to walk with a robotic ankle exoskeleton.J Biomech. 2007;40(12):2636-44. doi: 10.1016/j.jbiomech.2006.12.006. Epub 2007 Feb 2. J Biomech. 2007. PMID: 17275829 Clinical Trial.
-
Locomotor adaptation to a soleus EMG-controlled antagonistic exoskeleton.J Neurophysiol. 2013 Apr;109(7):1804-14. doi: 10.1152/jn.01128.2011. Epub 2013 Jan 9. J Neurophysiol. 2013. PMID: 23307949 Free PMC article.
-
Contributions to the understanding of gait control.Dan Med J. 2014 Apr;61(4):B4823. Dan Med J. 2014. PMID: 24814597 Review.
Cited by
-
The effect of involuntary motor activity on myoelectric pattern recognition: a case study with chronic stroke patients.J Neural Eng. 2013 Aug;10(4):046015. doi: 10.1088/1741-2560/10/4/046015. Epub 2013 Jul 17. J Neural Eng. 2013. PMID: 23860192 Free PMC article.
-
Comparison of sEMG Onset Detection Methods for Occupational Exoskeletons on Extensive Close-to-Application Data.Bioengineering (Basel). 2024 Jan 25;11(2):119. doi: 10.3390/bioengineering11020119. Bioengineering (Basel). 2024. PMID: 38391605 Free PMC article.
-
Review of control strategies for lower-limb exoskeletons to assist gait.J Neuroeng Rehabil. 2021 Jul 27;18(1):119. doi: 10.1186/s12984-021-00906-3. J Neuroeng Rehabil. 2021. PMID: 34315499 Free PMC article. Review.
-
A Biomechanical Comparison of Proportional Electromyography Control to Biological Torque Control Using a Powered Hip Exoskeleton.Front Bioeng Biotechnol. 2017 Jun 30;5:37. doi: 10.3389/fbioe.2017.00037. eCollection 2017. Front Bioeng Biotechnol. 2017. PMID: 28713810 Free PMC article.
-
Robotic lower limb exoskeletons using proportional myoelectric control.Annu Int Conf IEEE Eng Med Biol Soc. 2009;2009:2119-24. doi: 10.1109/IEMBS.2009.5333984. Annu Int Conf IEEE Eng Med Biol Soc. 2009. PMID: 19964579 Free PMC article.
References
-
- Colombo G, Wirz M, Dietz V. Driven gait orthosis for improvement of locomotor training in paraplegic patients. Spinal Cord. 2001;39:252–255. - PubMed
-
- Agrawal SK, Banala SK, Fattah A, Sangwan V, Krishnamoorthy V, Scholz JP, Hsu WL. Assessment of motion of a swing leg and gait rehabilitation with a gravity balancing exoskeleton. IEEE Transactions of Neural Systems and Rehabilitation Engineering. 2007;15:410–20. - PubMed
-
- Veneman JF, Kruidhof R, Hekman EE, Ekkelenkamp R, Van Asseldonk EH, van der Kooij H. Design and evaluation of the LOPES exoskeleton for interactive gait rehabilitation. IEEE Transactions on Neural Systems and Rehabilitation Engineering. 2007;15:379–86. - PubMed
