Meta-Analysis
. 2009 Feb 18;101(4):256-66.
doi: 10.1093/jnci/djn485. Epub 2009 Feb 10.

Aspirin for the chemoprevention of colorectal adenomas: meta-analysis of the randomized trials

Affiliations
Meta-Analysis

Aspirin for the chemoprevention of colorectal adenomas: meta-analysis of the randomized trials

Bernard F Cole et al. J Natl Cancer Inst. .

Abstract

Background: Multiple lines of evidence indicate that aspirin has an antineoplastic effect in the large bowel. Randomized clinical trials have been conducted to evaluate the effectiveness of aspirin for reducing the risk of colorectal adenomas. A meta-analysis of these trials will provide more precise estimates of the aspirin effect, both overall and in subgroups.

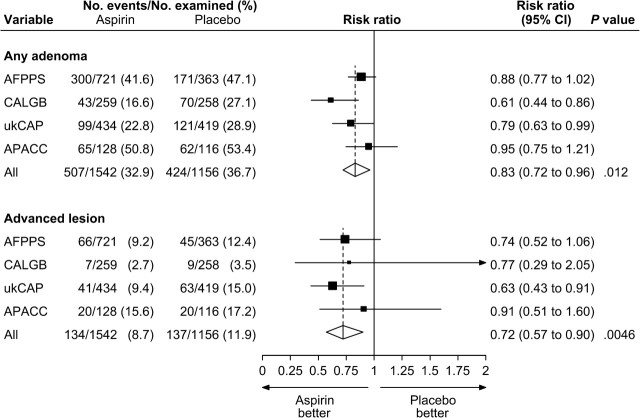
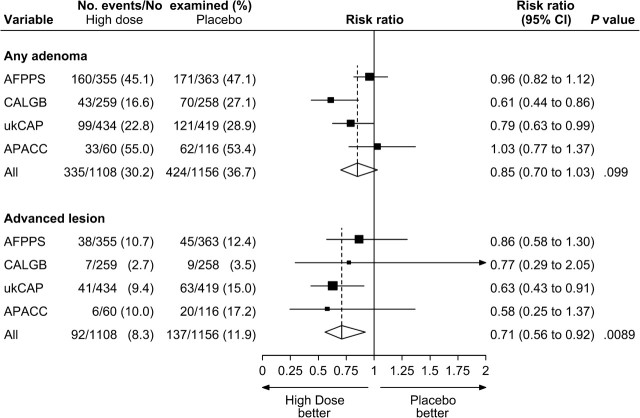
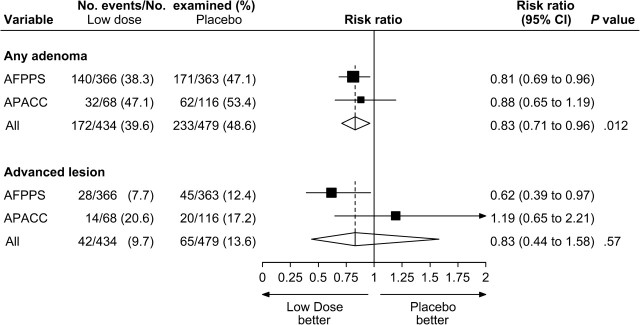
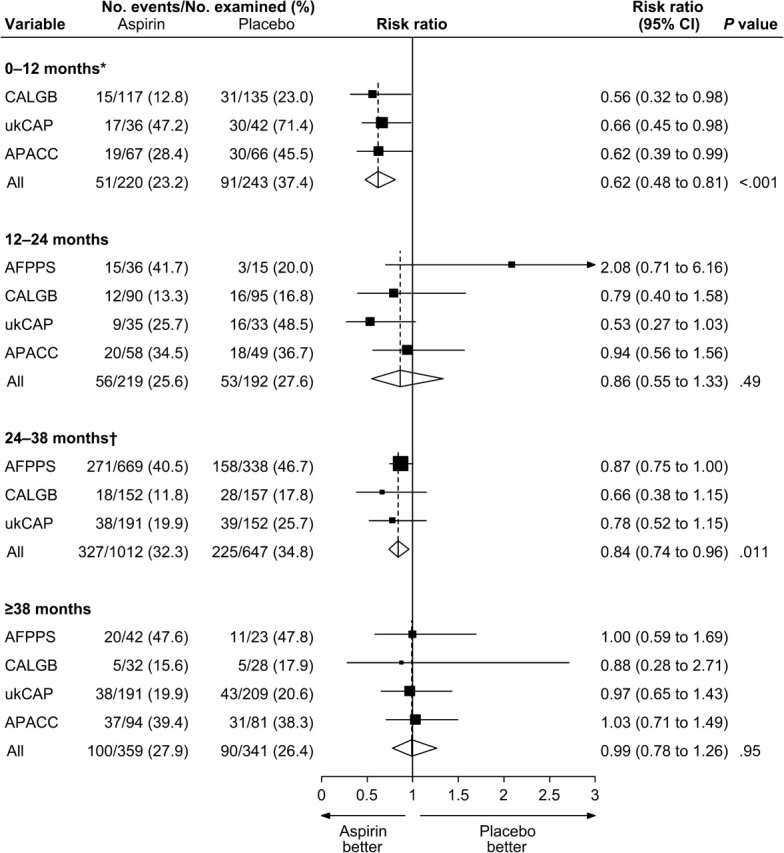
Methods: We combined data from all randomized double-blind placebo-controlled trials that evaluated aspirin for the prevention of colorectal adenomas. We used random-effects meta-analysis to estimate risk ratios and 95% confidence intervals (CIs) for the effect of aspirin on the occurrence of adenomas and of advanced lesions (ie, tubulovillous adenomas, villous adenomas, adenomas >or=1 cm in diameter, adenomas with high-grade dysplasia, or invasive cancer). All statistical tests were two-sided.

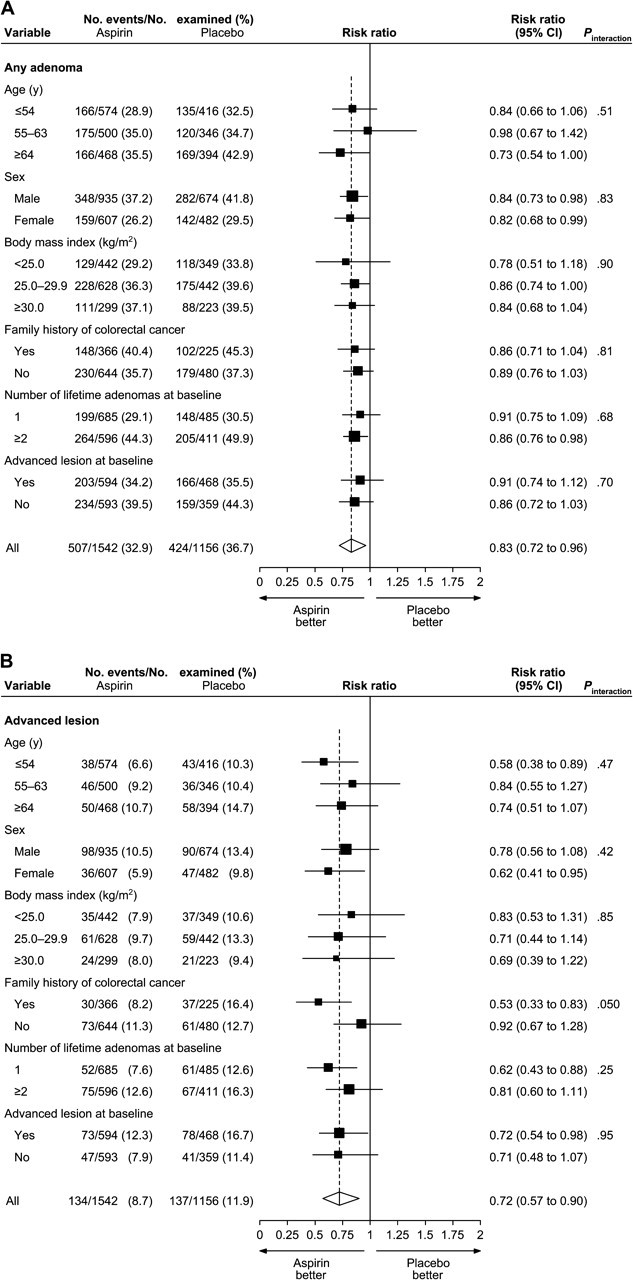
Results: We identified four clinical trials with 2967 randomly assigned participants. Each trial evaluated aspirin for the secondary prevention of colorectal adenomas. Doses of aspirin tested ranged from 81 to 325 mg/d. The average age of participants at baseline was 58 years, and 60% were male. Median follow-up was 33 months. A total of 2698 participants underwent colonoscopic follow-up and were included in the analysis of adenoma occurrence and advanced-lesion occurrence after randomization. Among these participants, adenomas were found in 424 (37%) of the 1156 participants allocated to placebo and in 507 (33%) of the 1542 participants allocated to any dose of aspirin. Advanced lesions were found in 12% of participants in the placebo group and in 9% of participants allocated to any dose of aspirin. The pooled risk ratio of any adenoma for any dose of aspirin vs placebo was 0.83 (95% CI = 0.72 to 0.96). This corresponded to an absolute risk reduction of 6.7% (95% CI = 3.2% to 10.2%). For any advanced lesion, the pooled risk ratio was 0.72 (95% CI = 0.57 to 0.90). We found no statistically significant effect modification for any of the baseline factors studied.

Conclusion: Aspirin is effective for the prevention of colorectal adenomas in individuals with a history of these lesions.


Figures

Figure 1
Figure 1
Random-effects risk ratio forest plot comparing any aspirin vs placebo. Trial-specific risk ratios are shown as black squares , with the size of the square being inversely proportional to the trial-specific risk ratio variance. Horizontal lines represent 95% confidence intervals for the trial-specific risk ratios. Pooled risk ratios are shown as diamonds . The middle of each diamond corresponds to the risk ratio, and the width of each diamond represents the 95% confidence interval. The vertical dashed lines provide a visual comparison of the pooled risk ratio with the corresponding trial-specific risk ratios. Tests for heterogeneity are as follows. For any adenoma, Q = 5.13 ( P = 0.16) and I 2 = 41.5. For advanced lesion, Q = 1.27 ( P = .74) and I 2 = 0.0. AFPPS = Aspirin/Folate Polyp Prevention Study; APACC = Association pour la Prevention par l’Aspirine du Cancer Colorectal; CALGB = Cancer and Leukemia Group B; CI = confidence interval; ukCAP = United Kingdom Colorectal Adenoma Prevention.
Figure 2
Figure 2
Random-effects risk ratio forest plot comparing higher-dose aspirin (300 or 325 mg/d) vs placebo. Trial-specific risk ratios are shown as black squares , with the size of the square being inversely proportional to the trial-specific risk ratio variance. Horizontal lines represent 95% confidence intervals for the trial-specific risk ratios. Pooled risk ratios are shown as diamonds . The middle of each diamond corresponds to the risk ratio, and the width of each diamond represents the 95% confidence interval. The vertical dashed lines provide a visual comparison of the pooled risk ratio with the corresponding trial-specific risk ratios. Tests for heterogeneity are as follows. For any adenoma, Q = 7.51 ( P = .057) and I 2 = 60.1. For advanced lesion, Q = 1.87 ( P = .60) and I 2 =0.0. AFPPS = Aspirin/Folate Polyp Prevention Study; APACC = Association pour la Prevention par l’Aspirine du Cancer Colorectal; CALGB = Cancer and Leukemia Group B; CI = confidence interval; ukCAP = United Kingdom Colorectal Adenoma Prevention.
Figure 3
Figure 3
Random-effects risk ratio forest plot comparing lower-dose aspirin (81 or 160 mg/d) vs placebo. Trial-specific risk ratios are shown as black squares , with the size of the square being inversely proportional to the trial-specific risk ratio variance. Horizontal lines represent 95% confidence intervals for the trial-specific risk ratios. Pooled risk ratios are shown as diamonds . The middle of each diamond corresponds to the risk ratio, and the width of each diamond represents the 95% confidence interval. The vertical dashed lines provide a visual comparison of the pooled risk ratio with the corresponding trial-specific risk ratios. Tests for heterogeneity are as follows. For any adenoma, Q = 0.21 ( P = .65) and I2 = 0.0. For advanced lesion, Q = 2.89 ( P = .089) and I2 = 65.4. AFPPS = Aspirin/Folate Polyp Prevention Study; APACC = Association pour la Prevention par l’Aspirine du Cancer Colorectal; CI = confidence interval.
Figure 4
Figure 4
Random-effects risk ratio forest plot comparing any aspirin vs placebo by subgroups. A) Any adenoma. B) Advanced lesion. Subgroup-specific risk ratios are shown as black squares , with the size of the square being inversely proportional to the subgroup-specific risk ratio variance. Horizontal lines represent 95% confidence intervals for the subgroup-specific risk ratios. Overall pooled risk ratios are shown as diamonds . The middle of each diamond corresponds to the risk ratio, and the width of each diamond represents the 95% confidence interval. The vertical dashed line provides a visual comparison of the pooled risk ratio with the subgroup-specific risk ratios. P values (two-sided) are based on Wald tests for interaction. Among those with follow-up data, body mass index was missing for 173 participants in the aspirin groups and 142 participants in the placebo group; family history of colorectal cancer was missing for 532 participants in the aspirin groups and 451 participants in the placebo group, including all participants in Cancer and Leukemia Group B (CALGB 9270); number of lifetime adenomas at baseline was missing for 261 participants in the aspirin groups and 260 participants in the placebo group, including all participants in CALGB 9270; advanced-lesion status at baseline was missing for 96 participants in the aspirin groups and 71 participants in the placebo group, with participants in CALGB 9270 being excluded from this subgroup analysis. CI = confidence interval.
Figure 5
Figure 5
Random-effects risk ratio forest plot comparing any aspirin vs placebo in terms of adenoma risk by time interval after randomization. Trial-specific risk ratios are shown as black squares , with the size of the square being inversely proportional to the trial-specific risk ratio variance. Horizontal lines represent 95% confidence intervals for the trial-specific risk ratios. Pooled risk ratios are shown as diamonds . The middle of each diamond corresponds to the risk ratio, and the width of each diamond represents the 95% confidence interval. The vertical dashed lines provide a visual comparison of the pooled risk ratios with the corresponding trial-specific risk ratios. *The AFPPS trial had no examinations during the 0- to 12-month interval. †The APACC trial had only two examinations during the 24- to 38-month interval. AFPPS = Aspirin/Folate Polyp Prevention Study; CALGB = Cancer and Leukemia Group B; APACC = Association pour la Prevention par l’Aspirine du Cancer Colorectal; CI = confidence interval; ukCAP = United Kingdom Colorectal Adenoma Prevention.

References

    1. Baron JA. Epidemiology of non-steroidal anti-inflammatory drugs and cancer. Prog Exp Tumor Res. 2003;37:1–24. - PubMed
    1. Flossmann E, Rothwell PM. Effect of aspirin on long-term risk of colorectal cancer: consistent evidence from randomised and observational studies. Lancet. 2007;369(9573):1603–1613. - PubMed
    1. Giardiello FM, Hamilton SR, Krush AJ, et al. Treatment of colonic and rectal adenomas with sulindac in familial adenomatous polyposis. New Engl J Med. 1993;328(18):1313–1316. - PubMed
    1. Labayle D, Fischer D, Vielh P, et al. Sulindac causes regression of rectal polyps in familial adenomatous polyposis. Gastroenterology. 1991;101(3):635–639. - PubMed
    1. Rigau J, Pique JM, Rubio E, Planas R, Tarrech JM, Bordas JM. Effects of long-term sulindac therapy on colonic polyposis. Ann Internal Med. 1991;115(12):952–954. - PubMed

Publication types

MeSH terms

Substances