. 2009 Feb 10;2(57):ra5.
doi: 10.1126/scisignal.2000081.

Brx mediates the response of lymphocytes to osmotic stress through the activation of NFAT5

Affiliations

Brx mediates the response of lymphocytes to osmotic stress through the activation of NFAT5

Tomoshige Kino et al. Sci Signal. .

Abstract

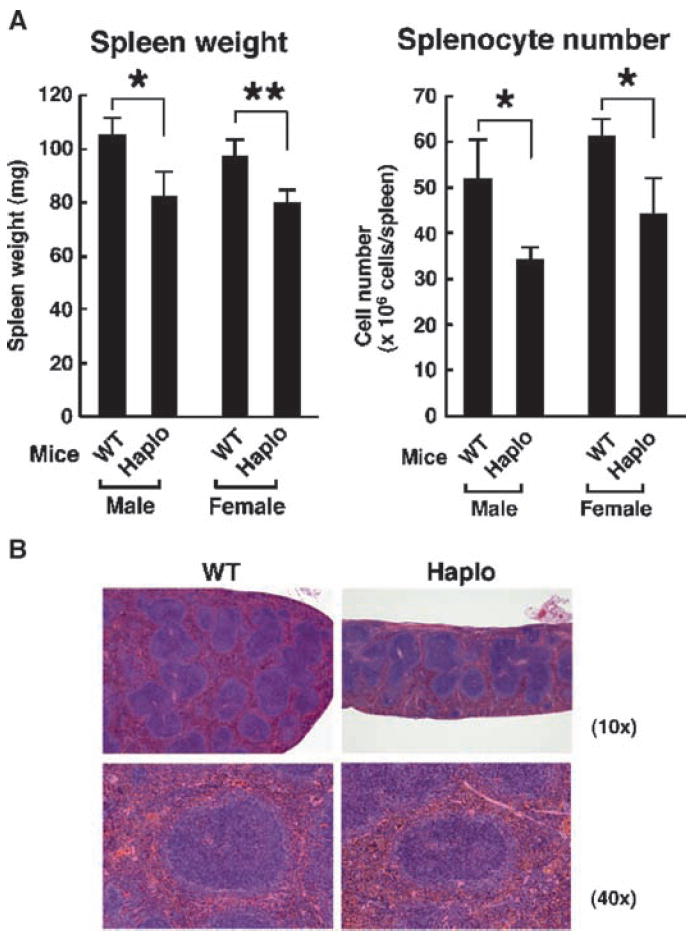
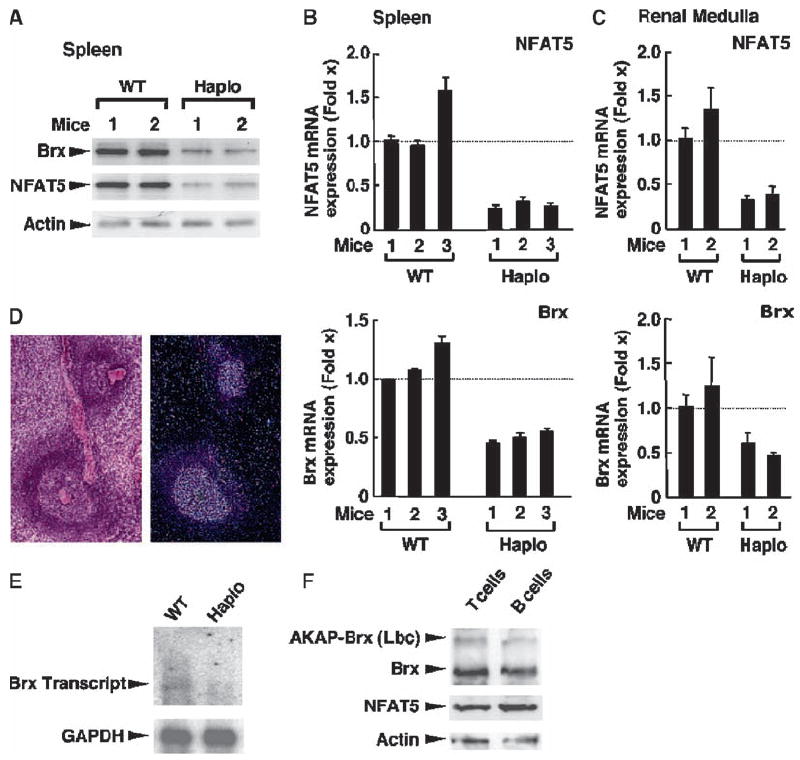
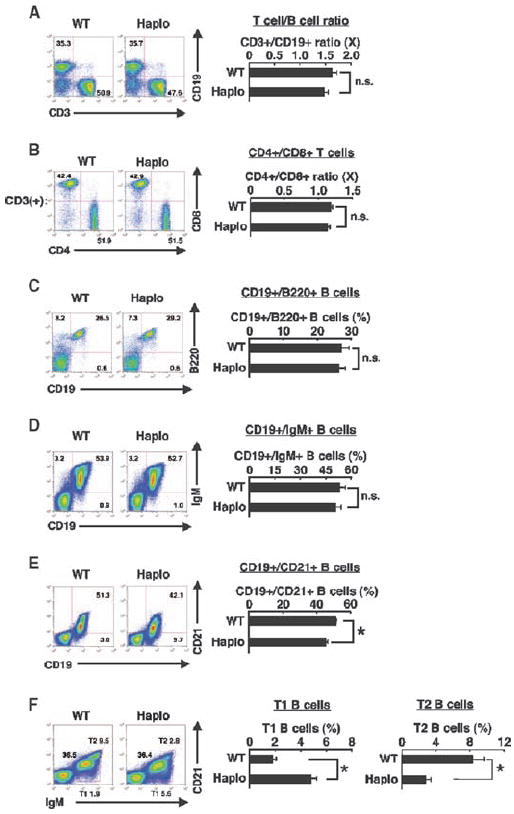
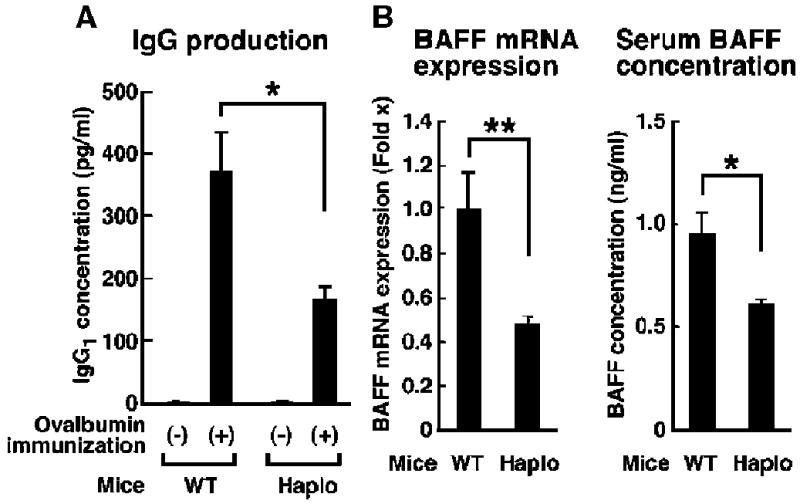
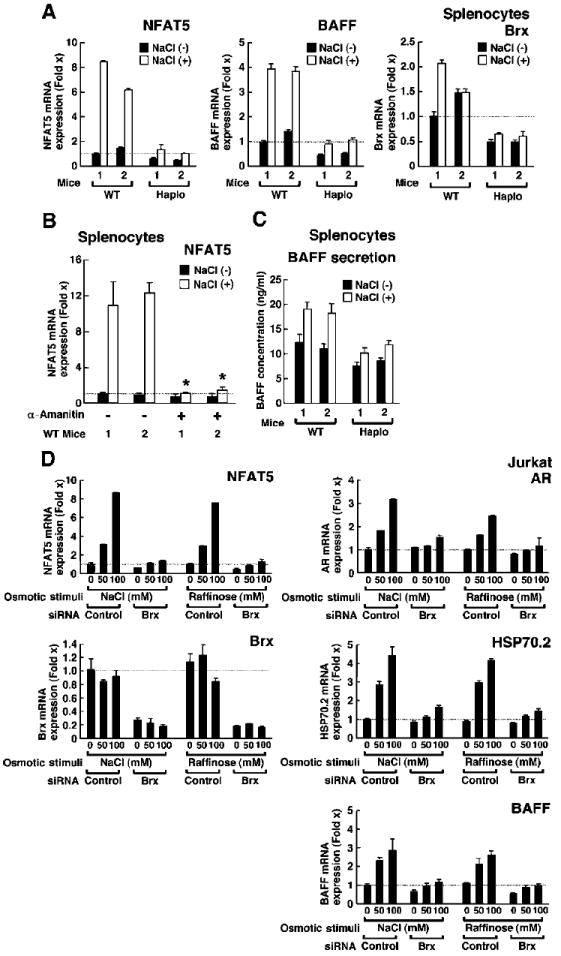
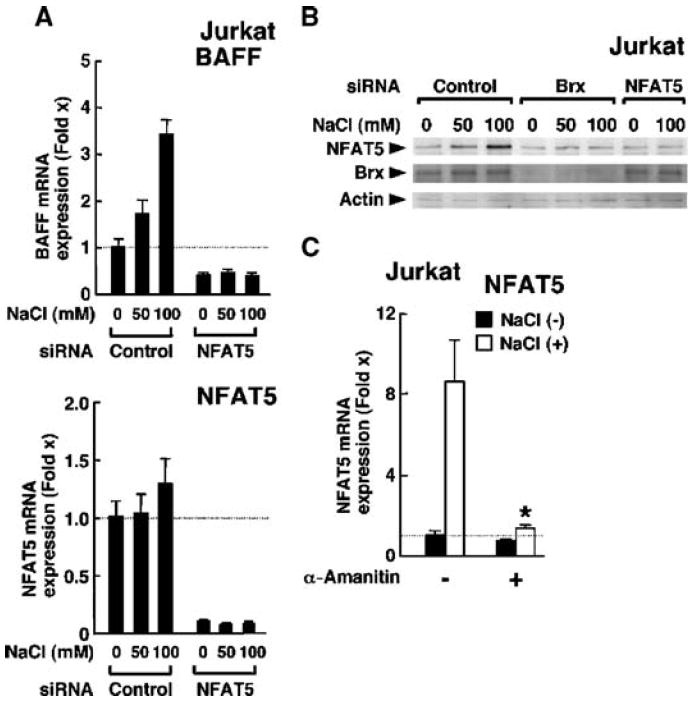
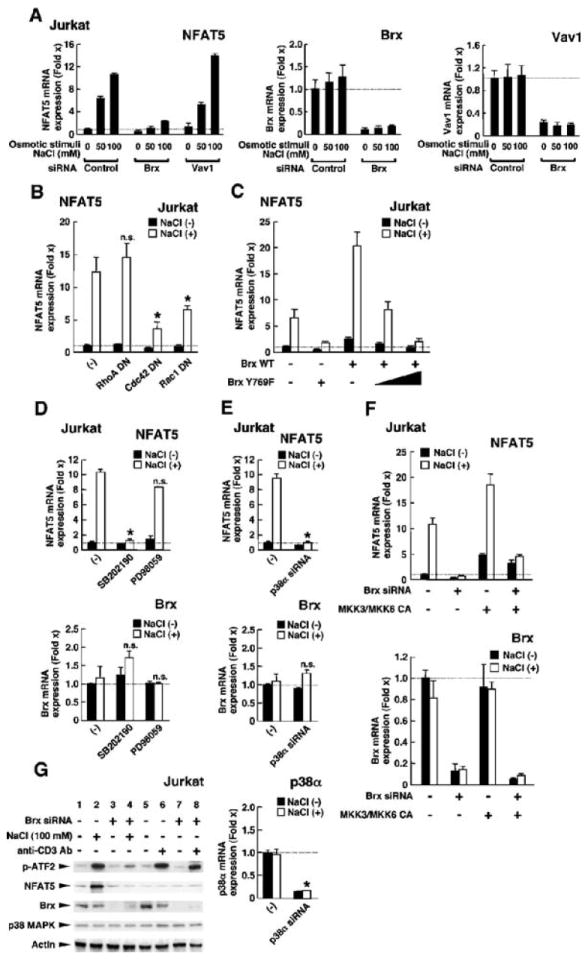
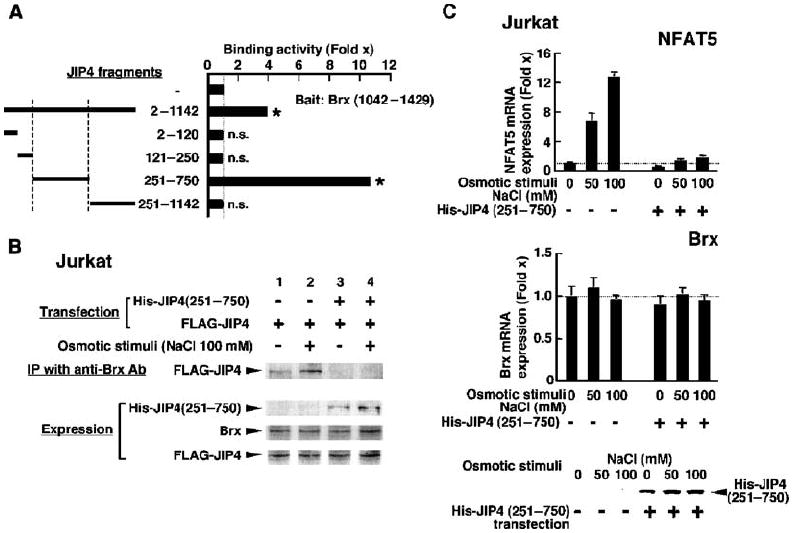
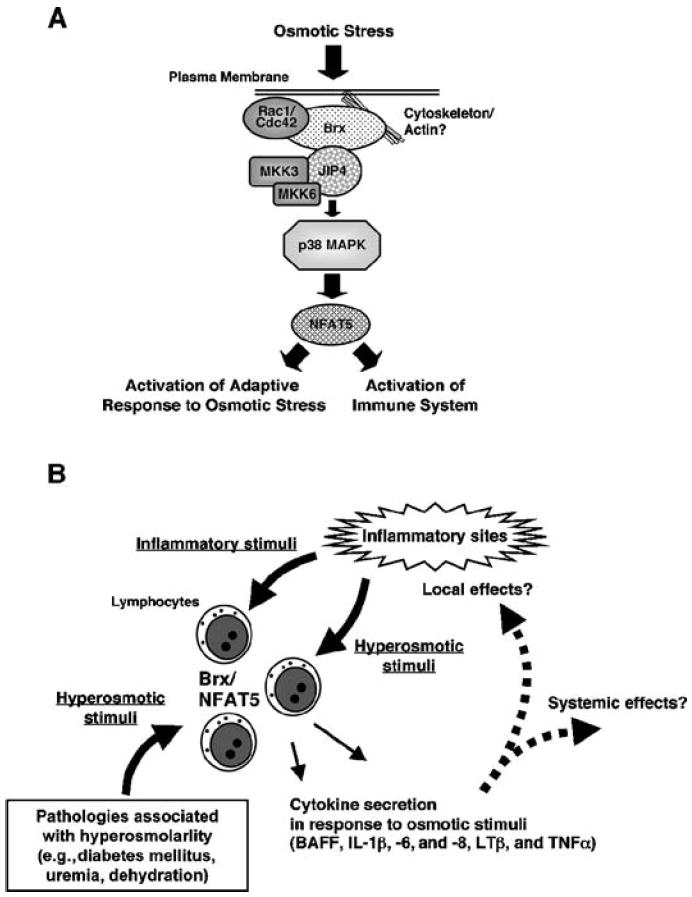
Extracellular hyperosmolarity, or osmotic stress, generally caused by differences in salt and macromolecule concentrations across the plasma membrane, occurs in lymphoid organs and at inflammatory sites. The response of immune cells to osmotic stress is regulated by nuclear factor of activated T cells 5 (NFAT5), a transcription factor that induces the expression of hyperosmolarity-responsive genes and stimulates cytokine production. We report that the guanine nucleotide exchange factor (GEF) Brx [also known as protein kinase A-anchoring protein 13 (AKAP13)] is essential for the expression of nfat5 in response to osmotic stress, thus transmitting the extracellular hyperosmolarity signal and enabling differentiation of splenic B cells and production of immunoglobulin. This process required the activity of p38 mitogen-activated protein kinase (MAPK) and NFAT5 and involved a physical interaction between Brx and c-Jun N-terminal kinase (JNK)-interacting protein 4 (JIP4), a scaffold molecule specific to activation of the p38 MAPK cascade. Our results indicate that Brx integrates the responses of immune cells to osmotic stress and inflammation by elevating intracellular osmolarity and stimulating the production of cytokines.


Figures

Fig. 1
Fig. 1
Characteristics of spleens from brx+/− mice. (A) The spleens from brx+/− (Haplo) mice weighed less and contained fewer splenocytes compared with those of WT mice. Data in the left panel represent the mean spleen weight, with error bars indicating the SEM (Haplo mice: male, n = 5; female, n = 7; WT mice: male, n = 5; female, n = 7), whereas those in the right panel represent the mean ± SEM of splenic mononuclear cells (Haplo mice: male, n = 5; female, n = 7; WT mice: male, n = 5; female, n = 7). *P < 0.05; **P < 0.01. (B) brx+/− mice exhibited an altered splenic follicular structure compared with that of WT mice. Results of hematoxylin and eosin (H&E) staining are shown and are representative of three experiments. The spleens of brx+/− mice had smaller follicles than did those of WT mice. Top and bottom panels show low- (10×) and high-magnification (40×) images, respectively.
Fig. 2
Fig. 2
Splenocytes from brx+/− mice have a lower abundance of Brx and NFAT5 proteins and mRNAs compared with those of WT mice. (A) Western blotting analysis showed decreased abundance of Brx and NFAT5 proteins in splenocytes from brx+/− (Haplo) mice compared with those of WT mice. The abundance of actin was used as a loading control. Results shown are from two mice from each group. (B) Spleens from brx+/− mice expressed decreased amounts of brx and nfat5 mRNAs compared with those of WT mice. The abundances of brx and nfat5 mRNAs in the splenocytes of three WT and three brx+/− mice (each measured in triplicate) were evaluated with a SYBR Green–based real-time RT-PCR assay. Data shown represent the mean relative abundance of nfat5 (top) and brx (bottom) mRNAs shown as the fold difference compared with baseline (set by WT mouse 1). Error bars indicate SEM. (C) The renal medulla of brx+/− mice expressed less nfat5 mRNA compared with that of WT mice. The abundances of brx and nfat5 mRNAs in the renal medulla of two WT and two brx+/− mice were evaluated (each in triplicate) by real-time RT-PCR. Data shown represent the mean relative abundance of nfat5 mRNA (top) and brx mRNA (bottom) shown as the fold difference compared with baseline (set by WT mouse 1). Error bars indicate SEM. (D) Transcripts of brx are expressed in the white pulp of the spleen. Results of H&E staining of a section of spleen from a WT mouse (left) are representative of three experiments. In situ hybridization of another section from the same spleen shows the expression of brx transcripts (right). (E) The abundance of brx mRNA is reduced in the spleen of brx+/− mice compared with that in the spleen of WT mice. Purified mRNA from the spleens of WT and brx+/− mice were analyzed by Northern blotting for the expression of brx and gapdh mRNAs. (F) Brx is the major protein expressed from brx (akap13), whereas NFAT5 is equally abundant in T cells and B cells purified from the spleens of WT mice. Whole-cell homogenates from T cells and B cells obtained from WT splenocytes were resolved by 4% SDS-PAGE, blotted onto nitrocellulose membranes, and Brx, AKAP-Brx, NFAT5, and actin proteins were visualized by Western blotting analysis with anti-Brx, anti-NFAT5, or anti-actin antibodies, respectively. Experiments presented in (D) to (F) were repeated three times and representative images are shown.
Fig. 3
Fig. 3
Flow cytometric analysis of subpopulations of splenocytes. Comparative analysis of splenocytes from WT and brx+/− (Haplo) mice based on their surface expression of (A) CD3 and CD19, (B) CD4 and CD8 (on CD3+ cells), (C) CD19 and B220, (D) CD19 and IgM, (E) CD19 and CD21, and (F) IgM and CD21. Representative flow cytometry experiments are shown in the left panels and pooled data from at least three independent experiments are shown in the right panels. Values shown are the means ± SEM of the ratios of the indicated cell populations when comparing WT to brx+/− mice. *P < 0.05; n.s., not significant (n = 3 to 5 mice).
Fig. 4
Fig. 4
brx+/− mice exhibit impaired humoral immunity. (A) In response to immunization with ovalbumin, brx+/− mice produced lower quantities of ovalbumin-specific IgG1 than did WT mice. Results shown represent the mean serum concentrations ± SEM of ovalbumin-specific IgG1 in six mice from each group. *P < 0.05 (n = 6 mice). (B) brx+/− mice exhibited lower quantities of baff mRNA in the spleen (left) and a lower concentration of circulating BAFF (right) than did WT mice. Data shown indicate the mean fold difference ± SEM in the abundance of baff mRNA in the spleens of WT and brx+/− mice (left) and in the serum concentrations of BAFF (right) in four mice from each group. *P < 0.05; **P < 0.02.
Fig. 5
Fig. 5
Brx is required for the increased expression of nfat5 and of endogenous NFAT5-responsive genes in response to osmotic stress. (A) Induction of the expression of nfat5 and baff mRNAs by osmotic stimulus was blunted in splenocytes from brx+/− (Haplo) mice compared with that in WT mice. Splenocytes from two WT and two brx+/− mice were incubated in the presence (open bars) or absence (filled bars) of 100 mM NaCl and the abundances of nfat5 mRNA (left), baff mRNA (middle), and brx mRNA (right) were determined by real-time RT-PCR analysis. Data shown represent the relative mean abundance ± SEM of nfat5, baff, and brx mRNAs shown as the fold induction over baseline (set by WT mouse 1 in the absence of NaCl). (B) Osmotic stimulus increases the abundance of nfat5 mRNA by stimulating its transcription in splenocytes. Triplicate samples of splenocytes from two WT mice were incubated with 100 mM NaCl in the absence or presence of 2 μM α-amanitin. Data shown represent the mean fold difference ± SEM in the abundance of nfat5 mRNA compared with baseline (set by splenocytes of WT mouse 1 cultured in the absence of NaCl and α-amanitin). *P < 0.01 (n = 3). (C) Secretion of BAFF is increased by an osmotic stimulus and is blunted in splenocytes from brx+/− mice compared with those from WT mice. Splenocytes obtained from two WT and two brx+/− mice were incubated in the presence (open bars) or absence (filled bars) of 100 mM NaCl and the concentration of BAFF secreted into the culture media was determined by ELISA (each mouse assayed in triplicate). Data shown represent the mean concentrations ± SEM of BAFF. (D) Brx is necessary for osmotic stimuli to induce the expression of nfat5 and of ar, hsp70-2, and baff mRNAs in Jurkat cells. Jurkat cells were transfected with control or Brx-specific siRNAs and incubated with the indicated concentrations of NaCl or raffinose. Data shown represent the mean fold difference ± SEM in the expression of nfat5, ar, hsp70-2, baff, and brx mRNAs compared with baseline (which was obtained from cells transfected with control siRNA and incubated in the absence of NaCl).
Fig. 6
Fig. 6
(A) Osmotic stimulus increases the expression of baff mRNA through the induction of nfat5 in Jurkat cells. Jurkat cells were transfected with control or NFAT5-specific siRNA and cultured in the indicated concentrations of NaCl. Data shown represent the mean fold difference ± SEM (n = 3) in the abundance of baff (top) and nfat5 (bottom) mRNAs compared with baseline (the value obtained from cells transfected with control siRNA and incubated in the absence of NaCl). (B) Brx is required for optimal production of NFAT5 protein in Jurkat cells in response to osmotic stimulus. Jurkat cells were transfected with control, Brx-specific siRNA, or NFAT5-specific siRNA and incubated with the indicated concentrations of NaCl. Cell homogenates were resolved by 4 to 20% SDS-PAGE and the abundances of NFAT5 (top gel), Brx (middle gel), and actin (bottom gel) were determined by Western blotting with their respective specific antibodies. Experiments were repeated three times and a representative image is shown. (C) Osmotic stimulus increases the expression of nfat5 in Jurkat cells. Jurkat cells were incubated with 100 mM NaCl in the absence or presence of 2 μM α-amanitin. Data shown represent the mean fold difference ± SEM in the abundance of nfat5 mRNA compared with baseline (the value obtained from Jurkat cells cultured in the absence of NaCl and α-amanitin). *P < 0.01 (the experiment was performed in triplicate).
Fig. 7
Fig. 7
The GEF domain of Brx, as well as Cdc42, Rac1, and p38 MAPK, are all required for an osmotic stimulus to induce the expression of nfat5 mRNA. (A) Brx, but not Vav1, is necessary for the induction of nfat5 expression in Jurkat cells in response to osmotic stimuli. Jurkat cells were transfected with control, Brx-specific siRNA, or Vav1-specific siRNA and incubated with the indicated concentrations of NaCl. Data shown represent the mean fold difference ± SEM in the relative abundance of nfat5 (left), brx (middle), and vav1 (right) mRNAs compared with baseline (the value obtained from the cells transfected with control siRNA and incubated in the absence of NaCl). (B) DN mutants of Cdc42 and Rac1, but not RhoA, suppress induction of nfat5 expression in Jurkat cells in response to osmotic stimuli. Jurkat cells were transfected with plasmids expressing DN mutants of RhoA, Cdc42, or Rac1 (RhoAT19N, Cdc42T17N, and Rac1T17N, respectively) and incubated with 100 mM NaCl. Data shown represent the mean fold difference ± SEM in the relative abundance of nfat5 mRNA compared with baseline (the value obtained from cells transfected with control plasmid and incubated in the absence of NaCl). *P < 0.01; n.s., not significant (the experiment was peformed in triplicate). (C) Induction of the expression of nfat5 mRNA in Jurkat cells in response to an osmotic stimulus requires the GEF domain of Brx, whereas a GEF-defective mutant Brx acts in a DN manner. Jurkat cells were transfected with a plasmid encoding WT Brx or the GEF-inactive mutant Brx and incubated with 100 mM NaCl. Data shown represent the mean fold difference ± SEM in the relative abundance of nfat5 mRNA compared with baseline (the value obtained from cells transfected with control plasmid and incubated in the absence of NaCl). (D) p38 MAPK, but not ERK1/2, is necessary for an osmotic stimulus to induce the expression of nfat5 mRNA in Jurkat cells. Jurkat cells were incubated with 2 μM of the p38 MAPK inhibitor SB202190 or 10 μM of the MEK1 inhibitor PD98059 in the absence or presence of 100 mM NaCl. Data shown represent the mean fold difference ± SEM in the relative abundance of nfat5 (top) and brx (bottom) mRNAs compared with baseline. *P < 0.01; n.s.: not significant (the experiment was performed in triplicate). (E) siRNA against p38α abolishes osmotic stimulus–induced expression of nfat5 mRNA. Jurkat cells were transfected with control or p38α-specific siRNA and cultured in the absence or presence of 100 mM NaCl. Data shown represent the mean fold difference ± SEM in the relative abundance of nfat5 (top), brx (center), and p38α (bottom) mRNAs compared with baseline (cells transfected with control siRNA and cultured in the absence of NaCl). *P < 0.01; n.s., not significant (the experiment was performed in triplicate). (F) Expression of the CA forms of MKK3 and MKK6 rescues the attenuation of osmotic stimulus–induced nfat5 expression caused by siRNA-mediated knockdown of Brx. Jurkat cells were transfected with control or Brx-specific siRNA in the absence or presence of MKK3- or MKK6-expressing plasmids and were cultured with or without 100 mM NaCl. Data shown represent the mean fold difference ± SEM in the relative expression of nfat5 (top) and brx (bottom) mRNAs compared with baseline (cells transfected with control siRNA and cultured in the absence of NaCl). (G) Osmotic stimulus activates p38 MAPK through Brx in Jurkat cells. Jurkat cells were transfected with control or Brx-specific siRNA and cultured in the absence or presence of 100 mM NaCl or 10 μg/ml of anti-CD3. The kinase activity of p38 MAPK was evaluated by examining the abundance of phosphorylated ATF2 by Western blotting (top gel). The abundances of NFAT5, Brx, and p38 MAPK proteins were also examined (second to fourth gels) by Western blotting. Actin (bottom gel) was used as a loading control.
Fig. 8
Fig. 8
JIP4 is required for Brx to mediate osmotic stimulus–induced increases in the expression of nfat5 in Jurkat cells. (A) JIP4 interacts with Brx(1042–1429) through a region of JIP4 flanked by amino acid residues 251 to 750. Yeast two-hybrid assays were performed with plasmids expressing Brx(1042–1429) fused to the DBD of GAL4 and the indicated JIP4 fragment fused to the AD of GAL4. Data shown represent the mean fold increase in binding activity ± SEM obtained by dividing the corrected β-galactosidase obtained in the presence of the indicated JIP4-AD fragments by those obtained in its absence. *P < 0.01; n.s., not significant (the experiment was performed in triplicate). (B) Brx associates with JIP4 in Jurkat cells in an osmotic stimulus–dependent fashion and overexpression of JIP4(250–750) attenuates this association. Jurkat cells were transfected with a plasmid expressing FLAG-JIP4 with or without a plasmid expressing His-JIP4(251–750) and incubated with 100 mM NaCl. Coimmunoprecipitation was performed with anti-Brx, and Brx-associated FLAG-JIP4 was visualized with anti-FLAG. Exogenously or endogenously expressed His-JIP4(251–750), Brx, and FLAG-JIP4 were visualized by Western blotting of samples from 10% of the cell lysates used in the coimmunoprecipitation reaction (IP). (C) Overexpression of JIP4(251–750) attenuates osmotic stimulus–induced increases in the expression of nfat5 mRNA. Jurkat cells were transfected with a plasmid expressing His-JIP4(251–750) and incubated with the indicated concentrations of NaCl. Data shown represent the mean fold-difference ± SEM in the relative abundance of nfat5 (top) and brx (middle) mRNAs compared with baseline (from cells transfected with control siRNA and cultured in the absence of NaCl). His-JIP4(251–750) (bottom) was visualized in the whole-cell homogenates obtained in the same experiment by Western blotting with anti-His.
Fig. 9
Fig. 9
The Brx-mediated osmotic stress-activated signaling system and its implications for the immune response. (A) Intracellular signaling pathway of lymphocytes in response to osmotic stress. The sensing of and response to osmotic stress is largely mediated by Brx through the activation of Rho-type small G proteins and the subsequent stimulation of the p38 MAPK cascade and of NFAT5. NFAT5 participates in the elevation of intracellular osmolarity of immune cells and plays an essential role in the induction of various cytokines perhaps as a response to the hyperosmolar environment of inflammatory sites and several immune and other organs. (B) The Brx- and NFAT5-mediated response to osmotic stress in inflammatory sites and in pathologic conditions associated with extracellular hyperosmolarity. In addition to infectious agents, inflammatory cytokines, and other bioactive compounds released by inflamed tissues, inflammation activates lymphocytes by osmotic stress. The Brx- and NFAT5-mediated intracellular signaling system stimulates the secretion of cytokines to modulate local and systemic inflammatory reactions, while it induces hyperosmolarity-responsive genes to protect lymphocytes from the hyperosmolar environment of inflammatory sites. Pathologic conditions associated with extracellular hyperosmolarity may alter the various functions of lymphocytes through activation of Brx- and NFAT5-mediated signaling system.

Similar articles

Cited by

References

    1. Burg MB, Kwon ED, Kultz D. Regulation of gene expression by hypertonicity. Annu Rev Physiol. 1997;59:437–455. - PubMed
    1. Häussinger D. The role of cellular hydration in the regulation of cell function. Biochem J. 1996;313:697–710. - PMC - PubMed
    1. Hohmann S. Osmotic stress signaling and osmoadaptation in yeasts. Microbiol Mol Biol Rev. 2002;66:300–372. - PMC - PubMed
    1. Tatebayashi K, Yamamoto K, Tanaka K, Tomida T, Maruoka T, Kasukawa E, Saito H. Adaptor functions of Cdc42, Ste50, and Sho1 in the yeast osmoregulatory HOG MAPK pathway. EMBO J. 2006;25:3033–3044. - PMC - PubMed
    1. Raitt DC, Posas F, Saito H. Yeast Cdc42 GTPase and Ste20 PAK-like kinase regulate Sho1-dependent activation of the Hog1 MAPK pathway. EMBO J. 2000;19:4623–4631. - PMC - PubMed

MeSH terms