. 2009 Apr 10;284(15):10232-42.
doi: 10.1074/jbc.M808387200. Epub 2009 Feb 11.

Ricin A chain insertion into endoplasmic reticulum membranes is triggered by a temperature increase to 37 {degrees}C

Affiliations

Ricin A chain insertion into endoplasmic reticulum membranes is triggered by a temperature increase to 37 {degrees}C

Peter U Mayerhofer et al. J Biol Chem. .

Abstract

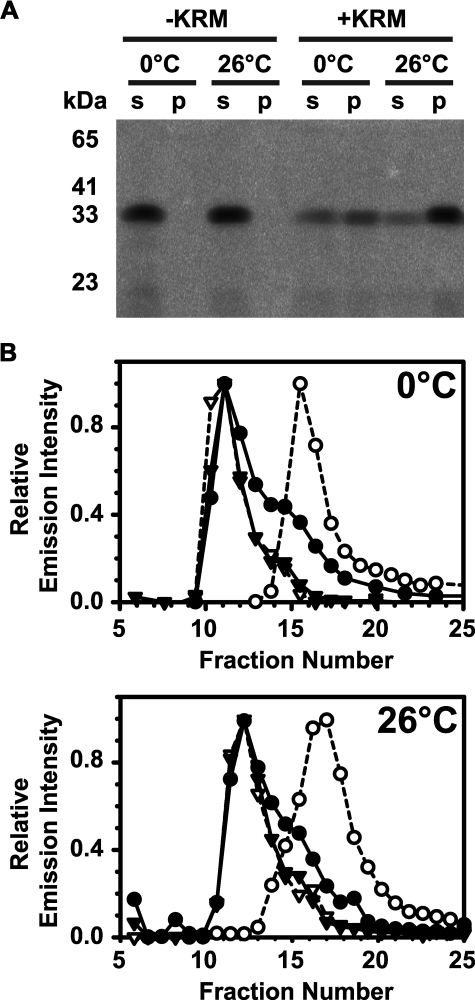
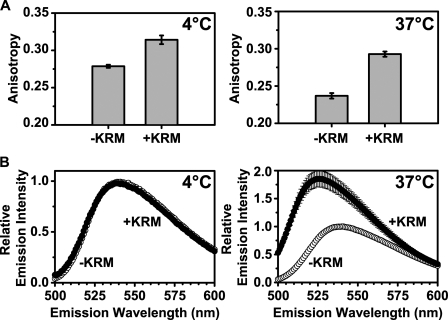
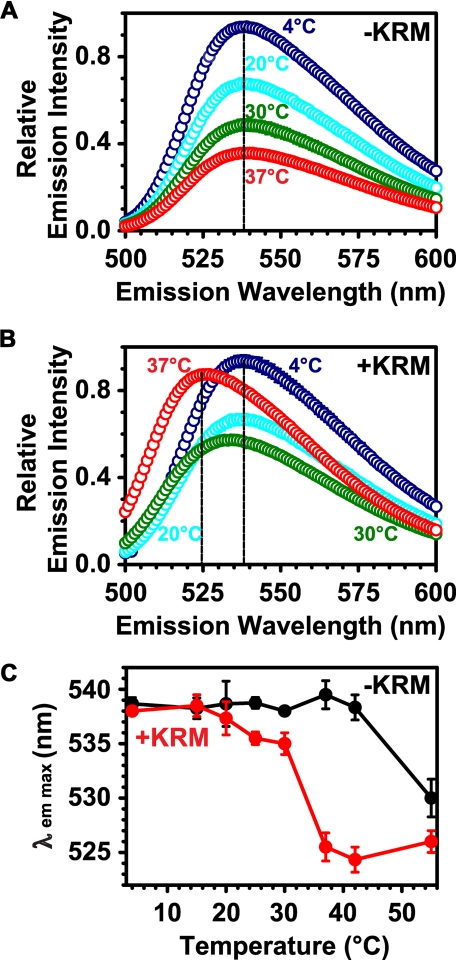
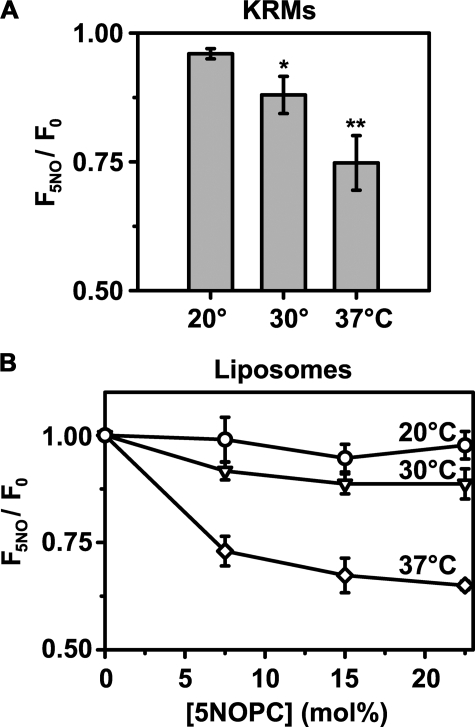
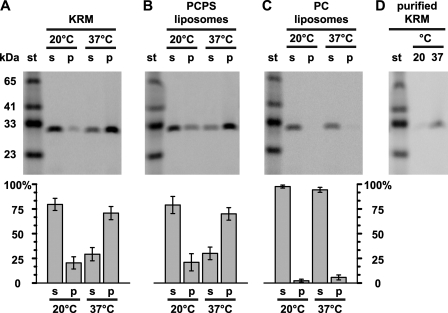
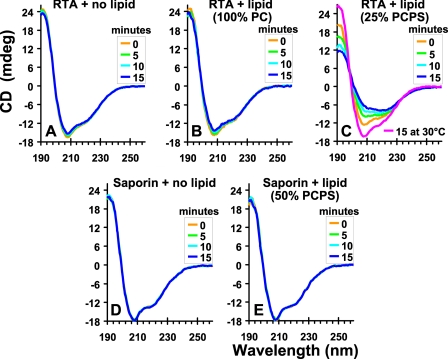
After endocytic uptake by mammalian cells, the heterodimeric plant toxin ricin is transported to the endoplasmic reticulum (ER), where the ricin A chain (RTA) must cross the ER membrane to reach its ribosomal substrates. Here, using gel filtration chromatography, sedimentation, fluorescence, fluorescence resonance energy transfer, and circular dichroism, we show that both fluorescently labeled and unlabeled RTA bind both to ER microsomal membranes and to negatively charged liposomes. The binding of RTA to the membrane at 0-30 degrees C exposes certain RTA residues to the nonpolar lipid core of the bilayer with little change in the secondary structure of the protein. However, major structural rearrangements in RTA occur when the temperature is increased. At 37 degrees C, membrane-bound toxin loses some of its helical content, and its C terminus moves closer to the membrane surface where it inserts into the bilayer. RTA is then stably bound to the membrane because it is nonextractable with carbonate. The sharp temperature dependence of the structural changes does not coincide with a lipid phase change because little change in fluorescence-detected membrane mobility occurred between 30 and 37 degrees C. Instead, the structural rearrangements may precede or initiate toxin retrotranslocation through the ER membrane to the cytosol. The sharp temperature dependence of these changes in RTA further suggests that they occur optimally in mammalian targets of the plant toxin.


Figures

FIGURE 1.
FIGURE 1.
RTA binds to ER microsomal membranes. 0.25 μm (A) 2.5 μm (B) RTA259-NBD were incubated in buffer H for 30 min on ice (0 °C) or at 26 °C with either microsomal membranes (+KRM; 20-40 eq) or an equal amount of buffer without microsomes (-KRM). Free RTA259-NBD was then separated from KRM-bound RTA259-NBD either by sedimentation (A) or by gel filtration chromatography (B). A, following sedimentation, the supernatant (s) and the microsomal pellet (p) were analyzed by SDS-PAGE. NBD-labeled proteins were visualized using a fluorescence imager. B, following mixing, free and KRM-bound RTA259-NBD were separated by gel filtration chromatography in buffer H at 4 °C using a Sepharose CL-2B column (8 × 0.5-cm inner diameter). Each fraction was scanned for the presence of RTA259-NBD (•; λex = 468 nm; λem = 530 nm) and KRMs (▾; λex = 405 nm; λem = 420 nm). As controls, only RTA259-NBD (○) or only KRMs (▿) were run and analyzed separately.
FIGURE 2.
FIGURE 2.
RTA259-NBD binds to microsomes differently at 4 °C and 37 °C. Anisotropy measurements (A) and emission scans (B; λex = 468 nm) of RTA259-NBD (450 nm) were performed before (-KRM) and immediately after the addition of ER microsomal membranes (+KRM; 15-20 eq) in buffer H. Emission intensity and anisotropy data were corrected by the subtraction of the signal obtained from an equivalent NBD-free RTA sample. The averages of at least three independent experiments are shown, and the error bars indicate the S.D. of the experiments.
FIGURE 3.
FIGURE 3.
Temperature dependence of the RTA259-NBD probe environment. Net emission scans (λex = 468 nm) of RTA259-NBD (450 nm) are shown in the presence of either microsome buffer (A) or of KRMs (B; 15-20 eq) at increasing temperatures in buffer H (A and B: only 4, 20, 30, and 37 °C are shown). The λem max at different temperatures is shown in (C). The averages of three independent experiments are shown, and the error bars indicate the S.D. of the experiments. However, most of the error bars in A and B are smaller than the circles on the graph.
FIGURE 4.
FIGURE 4.
Temperature and PS dependence of RTA binding to liposomes. Trp emission spectra (λex = 280 nm) of 7 μm RTA are shown in the absence (A) and presence (B) of 200 μm PCPS liposomes at 30 °C and 37 °C in buffer C. The λem max of RTA Trp emission was determined as a function of phospholipid concentration and composition (C). The error bars show S.D. from two or three experiments. D, after the addition of liposomes at 0 s, Trp emission intensity at 300 nm (FL) was monitored over time relative to the initial liposome-free intensity (F0). Emission intensity data were corrected by both subtraction of the signal obtained from samples lacking RTA and subtraction of the signal obtained by RTA or saporin alone. The average of at least two different experiments is shown. E and F, RTA was incubated for 30 min at 37 °C with 200 μm PCPS liposomes, the mixture was subjected to gel filtration on a Sepharose CL-2B column (18 × 0.5-cm inner diameter), and 250-μl fractions were collected. The samples were analyzed for RTA emission intensity (λex = 280 nm; λem = 322 nm; E) and protein content by SDS-PAGE followed by silver staining (F). The lanes are labeled in fraction numbers with S indicating the loaded supernatant of given fractions following a 10-min microcentrifuge centrifugation at 14,000 rpm.
FIGURE 5.
FIGURE 5.
Exposure of RTA259-NBD to the membrane interior. The emission intensity of RTA259-NBD (450 nm in buffer H) was measured before and after the addition of either KRMs (20 eq; A) or 600 μm PCPS liposomes (B). Emission intensities of parallel samples containing either 5NOPC (F5NO) or an equal mol% of POPC (F0) were compared. The net emission intensities are shown as a function of the mol% of 5NOPC in the liposomes (B), but the final mol% of 5NOPC/POPC in the bulk lipid of natural ER membranes (A) cannot be quantified. The averages of at least three independent experiments are shown, and the errorbars indicate the S.D. of the experiments. *, p = 0.208; **, p = 0.006 compared with the quenching efficiency at 20 °C, respectively (Student's t test).
FIGURE 6.
FIGURE 6.
Some membrane-bound RTA is stably embedded in the bilayer. RTA259-NBD (500 nm) was incubated with either 40 eq of KRMs (A and D), or 2.5 mm PCPS liposomes (B) in buffer H for 30 min at 20 °C or 37 °C. Membrane-bound RTA was purified by centrifugation and then extracted with alkaline sodium carbonate. The protein contents of the supernatant (s), the membrane pellet (p) fractions, and a molecular weight standard (st) were then analyzed by SDS-PAGE. C, RTA259-NBD (1 μm) was incubated with 5 mm PC liposomes in 10 mm HEPES (pH 7.5) for 30 min at 20 °C or 37 °C. The samples were then treated as in B. D, KRMs were incubated with RTA259-NBD, treated with carbonate, and then purified using a sucrose step gradient as described under “Experimental Procedures.” NBD-labeled proteins were visualized and quantified using a fluorescence imager. Representative gels from a set of at least three independent experiments are shown. Histograms show the average fraction of the total protein in the supernatant and membrane pellet fractions, respectively. The error bars indicate the S.D. of the experiments.
FIGURE 7.
FIGURE 7.
Secondary structural changes in RTA and saporin. Recordings of the far-UV CD spectra of RTA and saporin, each 5 μm in buffer C at 37 °C, in the absence or presence of 200 μm liposomes containing different percentages of PC or PS. The scans were corrected by the subtraction of blanks containing only buffer and/or liposomes. The panels show the averaged spectra of at least two experiments.
FIGURE 8.
FIGURE 8.
Exposure of different RTA residues to the membrane interior. A, the tube worm representation of the α-carbon backbone of the RTA crystal structure is shown. Amino acids that are exposed to the membrane at 20 °C are shown in green, whereas amino acids that are exposed to the nonpolar lipid core only at 37 °C are indicated in red. B, the emission intensities of NBD-labeled RTA mutants (450 nm in buffer H) were measured before and after the addition of PCPS liposomes. Emission intensities of parallel samples containing either 22.5 mol% 12NOPC (F12NO) or 22.5 mol% of PC (F0) were compared at 20 °C (gray bars) or at 37 °C (black bars), respectively. The averages of at least three independent experiments are shown, and the error bars indicate the S.D. of the experiments. Sequence numbers of NBD-labeled amino acids are shown on the x axis. *, p = 0.0004; **, p = 0.04; ***, p = 0.07 when compared with the corresponding quenching efficiency at 20 °C (Student's t test). C and D, the ratio of RTA mutant (450 nm in buffer H) NBD emission intensity (C) and the change in λem max (D) are shown before (F0) and after (FKRM) binding to KRMs (20 eq), either at 20 °C (gray bars) or at 37 °C (black bars). The average of at least three independent experiments is shown, and the error bars indicate the S.D. of the experiments. A, *, p < 0.00004; **, p < 0.0002. B, *, p < 0.00001; **, p < 0.001 when the measurements at 20 °C were compared with those at 37 °C (Student's t test).

References

    1. Roberts, L. M., and Lord, J. M. (2004) Mini Rev. Med. Chem. 4 505-512 - PubMed
    1. Rapak, A., Falnes, P. O., and Olsnes, S. (1997) Proc. Natl. Acad. Sci. U. S. A. 94 3783-3788 - PMC - PubMed
    1. Spooner, R. A., Watson, P. D., Marsden, C. J., Smith, D. C., Moore, K. A., Cook, J. P., Lord, J. M., and Roberts, L. M. (2004) Biochem. J. 383 285-293 - PMC - PubMed
    1. Wesche, J., Rapak, A., and Olsnes, S. (1999) J. Biol. Chem. 274 34443-34449 - PubMed
    1. Argent, R. H., Roberts, L. M., Wales, R., Robertus, J. D., and Lord, J. M. (1994) J. Biol. Chem. 269 26705-26710 - PubMed

Publication types

LinkOut - more resources