Comparative Study
. 2009 Mar;94(3):355-63.
doi: 10.3324/haematol.13269. Epub 2009 Feb 11.

Comparative analysis of oncogenic properties and nuclear factor-kappaB activity of latent membrane protein 1 natural variants from Hodgkin's lymphoma's Reed-Sternberg cells and normal B-lymphocytes

Affiliations
Comparative Study

Comparative analysis of oncogenic properties and nuclear factor-kappaB activity of latent membrane protein 1 natural variants from Hodgkin's lymphoma's Reed-Sternberg cells and normal B-lymphocytes

Nathalie Faumont et al. Haematologica. 2009 Mar.

Abstract

Background: In Epstein-Barr virus-associated Hodgkin's lymphomas, neoplastic Reed-Sternberg cells and surrounding non-tumor B-cells contain different variants of the LMP1-BNLF1 oncogene. In this study, we raised the question of functional properties of latent membrane protein 1 (LMP1) natural variants from both Reed-Sternberg and non-tumor B-cells.

Design and methods: Twelve LMP1 natural variants from Reed-Sternberg cells, non-tumor B-cells of Hodgkin's lymphomas and from B-cells of benign reactive lymph nodes were cloned, sequenced and stably transfected in murine recombinant interleukin-3-dependent Ba/F3 cells to search for relationships between LMP1 cellular origin and oncogenic properties as well as nuclear factor-kappaB activation, and apoptosis protection.

Results: LMP1 variants of Reed-Sternberg cell origin were often associated with increased mutation rate and with recurrent genetic events, such as del15bp associated with S to N replacement at codon 309, and four substitutions I85L, F106Y, I122L, and M129I. Oncogenic potential (growth factor-independence plus clonogenicity) was consistently associated with LMP1 variants from Reed-Sternberg cells, but inconstantly for LMP1-variants from non-tumor B-cells. Analysis of LMP1 variants from both normal B-cells and Reed-Sternberg cells indicates that protection against apoptosis through activation of nuclear factor-kappaB - whatever the cellular origin of LMP1 - was maintained intact, regardless of the mutational pattern.

Conclusions: Taken together, our results demonstrate that preserved nuclear factor-kappaB activity and protection against apoptosis would be the minimal prerequisites for all LMP1 natural variants from both normal and tumor cells in Hodgkin's lymphomas, and that oncogenic potential would constitute an additional feature for LMP1 natural variants in Reed-Sternberg cells.


Figures

Figure 1.
Figure 1.
LMP1 expression in LMP1-Ba/F3 clones. Murine Ba/F3 cells were stably transfected with pCR3.1 vectors leading to the expression of RS, NT and RN-LMP1-variants. The vectors pCR3.1-B95.8 and -neo were used as controls. LMP1 expression was tested by an immunoblotting method using anti-LMP1 and anti-β-actin antibodies. The relative level of LMP1 was normalized to β-actin. The B95.8-LMP1-Ba/F3 clone was used as the reference control and set at 1. To maintain the order of the LMP1-Ba/F3 clones, different parts of the filter were used, and dividing lines were inserted.
Figure 2.
Figure 2.
Oncogenicity of LMP1 natural variants on the Ba/F3 lymphoid cellular model. Proliferation in mrIL-3 starved medium and formation of macroscopic colonies in soft agar, i.e. clonogenicity of LMP1-Ba/F3 clones. Left axis, cells were cultured in mrIL-3-free medium for 6 days. At day 3, residual proliferation of neo- or LMP1-Ba/F3 clone was normalized to its control in the presence of mrIL-3, i.e. relative proliferation rate without mrIL-3 versus with mrIL-3. Right axis, cells were suspended in 10% FCS medium and 2 ng/mL of mrIL-3 with 0.3% agar. After 3 weeks, colonies were stained by MTT and counted. The percentage of colonies is the number of colonies divided by the number of seeded cells. Error bars indicate the standard error from the mean from three independent sets of triplicate experiments. A significant difference (p<0.05) compared to the control neo-Ba/F3 clone using Student’s t test is indicated by an asterisk (*). Two independent LMP1-Ba/F3 clones were tested for RS1, NT6, RN1, and RN3-LMP1-variants, giving similar results (data not shown).
Figure 3.
Figure 3.
NF-κB transcriptional activity of LMP1 natural variants. After 17 h of mrIL-3 starvation, neo- and LMP1-Ba/F3 clones were co-transfected with a Renilla luciferase vector (pRL-TK) and 3X-κB-L vector, with three copies of the MHC class I κB site upstream of a Firefly luciferase reporter gene, or its mutated counterpart 3X-mutκB-L plasmid (indicated by m*). Results are expressed as NF-κB relative transcriptional activity which is the ratio between Firefly and Renilla luciferase activities relative to NF-κB transcriptional activity of parental Ba/F3 cells. Each bar corresponds to the mean of at least four independent experiments. Error bars represent the corresponding standard error from the mean. A significant difference (p<0.05) compared to the reference B95.8-LMP1-Ba/F3 clone using Student’s t test is indicated by an asterisk (*).
Figure 4.
Figure 4.
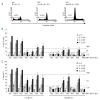
Effect of mrIL-3 starvation on the induction of apoptosis of LMP1-Ba/F3 clones. (A) Typical histograms of sub-G1 peak of neo., RS2 and RS4-LMP1-Ba/F3 clones after 72 h of mrIL-3 starvation. On each histogram, the percentage of cells with a decreased DNA content (sub G1), and the corresponding NF-κB relative transcriptional activity (Figure 3) are indicated. (B and C) Percentages of apoptotic cells after mrIL-3 starvation of neo- and LMP1-Ba/F3 clones. Apoptosis was assessed by flow cytometry measuring the sub-G1 peak (B) and annexin V-positive cells (C). The time course of mrIL-3 starvation was from 0-72 h. The dotted lines represent the cut-offs for defining the three categories of apoptosis level: low, intermediate (Int.) and high indicated on the right. Each bar corresponds to the mean of at least three independent experiments. Error bars represent the corresponding standard error from the mean. A significant difference (p<0.05) compared to the neo-Ba/F3 clone using Student’s t test is indicated by an asterisk (*).

References

    1. Thorley-Lawson DA. EBV the prototypical human tumor virus-just how bad is it? J Allergy Clin Immunol. 2005;116:251–61. - PubMed
    1. Young LS, Rickinson AB. Epstein-Barr virus: 40 years on. Nat Rev Cancer. 2004;4:757–68. - PubMed
    1. Kaye KM, Izumi KM, Kieff E. Epstein-Barr virus latent membrane protein 1 is essential for B-lymphocyte growth transformation. Proc Natl Acad Sci USA. 1993;90:9150–4. - PMC - PubMed
    1. Kulwichit W, Edwards RH, Davenport EM, Baskar JF, Godfrey V, Raab-Traub N. Expression of the Epstein-Barr virus latent membrane protein 1 induces B cell lymphoma in transgenic mice. Proc Natl Acad Sci USA. 1998;95:11963–8. - PMC - PubMed
    1. Gires O, Zimber-Strobl U, Gonnella R, Ueffing M, Marschall G, Zeidler R, et al. Latent membrane protein 1 of Epstein-Barr virus mimics a constitutively active receptor molecule. Embo J. 1997;16:6131–40. - PMC - PubMed

Publication types

MeSH terms