. 2009 May;83(9):4163-73.
doi: 10.1128/JVI.02445-08. Epub 2009 Feb 11.

Genomic epidemiology of a dengue virus epidemic in urban Singapore

Affiliations

Genomic epidemiology of a dengue virus epidemic in urban Singapore

Mark J Schreiber et al. J Virol. 2009 May.

Abstract

Dengue is one of the most important emerging diseases of humans, with no preventative vaccines or antiviral cures available at present. Although one-third of the world's population live at risk of infection, little is known about the pattern and dynamics of dengue virus (DENV) within outbreak situations. By exploiting genomic data from an intensively studied major outbreak, we are able to describe the molecular epidemiology of DENV at a uniquely fine-scaled temporal and spatial resolution. Two DENV serotypes (DENV-1 and DENV-3), and multiple component genotypes, spread concurrently and with similar epidemiological and evolutionary profiles during the initial outbreak phase of a major dengue epidemic that took place in Singapore during 2005. Although DENV-1 and DENV-3 differed in viremia and clinical outcome, there was no evidence for adaptive evolution before, during, or after the outbreak, indicating that ecological or immunological rather than virological factors were the key determinants of epidemic dynamics.


Figures
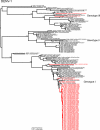
FIG. 1.
FIG. 1.
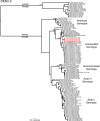
Phylogenetic relationships of 145 complete genomes DENV-1 sampled globally determined by using a ML method. Isolates sampled from Singapore are shown in red, and individual genotypes are shown. Bootstrap values (>80%) are shown next to key nodes, and all horizontal branch lengths are drawn to scale.
FIG. 2.
FIG. 2.
Phylogenetic relationships of 116 complete genomes DENV-2 sampled globally determined by using a ML method. Isolates sampled from Singapore are shown in red, and individual genotypes are shown. Bootstrap values (>80%) are shown next to key nodes, and all horizontal branch lengths are drawn to scale.
FIG. 3.
FIG. 3.
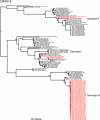
Phylogenetic relationships of 122 complete genomes DENV-3 sampled globally determined by using a ML method. Isolates sampled from Singapore are shown in red, and individual genotypes are shown. Bootstrap values (>80%) are shown next to key nodes, and all horizontal branch lengths are drawn to scale.
FIG. 4.
FIG. 4.
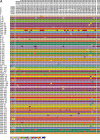
Observed amino acid changes in DENV-1 (A) and DENV-3 (B). Viral isolates are plotted on the x axis. The aligned polyproteins of each virus were compared to count the number and distribution of amino acid changes. Positions that were not completely conserved are shown with the individual protein name and the amino acid position within the protein on the y axis. The color of each square indicates the type of amino acid residue found in isolate x at position y.
FIG. 4.
FIG. 4.
Observed amino acid changes in DENV-1 (A) and DENV-3 (B). Viral isolates are plotted on the x axis. The aligned polyproteins of each virus were compared to count the number and distribution of amino acid changes. Positions that were not completely conserved are shown with the individual protein name and the amino acid position within the protein on the y axis. The color of each square indicates the type of amino acid residue found in isolate x at position y.
FIG. 5.
FIG. 5.
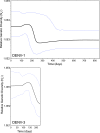
Population dynamics of DENV-1 and DENV-3 in Singapore during 2005 depicted using Bayesian skyline plots. The plots show changes in relative genetic diversity, depicted as the effective number of infections (Neτ), through time. The black line represents the mean estimate of Neτ, while the 95% HPD intervals are shown in blue. Time is shown as the number of days from the most recent sample. To aid interpretation, DENV-1 and DENV-3 have been shown on the same time axis.
FIG. 6.
FIG. 6.
Distribution of pairwise nucleotide, temporal, and geographic distances among complete coding sequences of DENV-1 and DENV-3 combined. Histograms show the frequency of temporal and nucleotide distances on the x and y axes, respectively. Each pair is represented as a point, and the color of the point indicates the physical distance between the home address of the patients from whom the viruses were isolated.

References

    1. Bennett, S. N., E. C. Holmes, M. Chirivella, D. M. Rodriguez, M. Beltran, V. Vorndam, D. J. Gubler, and W. O. McMillan. 2006. Molecular evolution of dengue 2 virus in Puerto Rico: positive selection in the viral envelope accompanies clade reintroduction. J. Gen. Virol. 87885-893. - PubMed
    1. de Oliveira, T., O. G. Pybus, A. Rambaut, M. Salemi, S. Cassol, M. Ciccozzi, G. Rezza, G. C. Gattinara, R. D'Arrigo, M. Amicosante, L. Perrin, V. Colizzi, and C. F. Perno. 2006. Molecular epidemiology: HIV-1 and HCV sequences from Libyan outbreak. Nature 444836-837. - PubMed
    1. Drummond, A. J., S. Y. Ho, M. J. Phillips, and A. Rambaut. 2006. Relaxed phylogenetics and dating with confidence. PLoS Biol. 4e88. - PMC - PubMed
    1. Drummond, A. J., and A. Rambaut. 2007. BEAST: Bayesian evolutionary analysis by sampling trees. BMC Evol. Biol. 7214. - PMC - PubMed
    1. Drummond, A. J., A. Rambaut, B. Shapiro, and O. G. Pybus. 2005. Bayesian coalescent inference of past population dynamics from molecular sequences. Mol. Biol. Evol. 221185-1192. - PubMed

Publication types

MeSH terms