Comparative Study
. 2009 Feb 11;29(6):1648-56.
doi: 10.1523/JNEUROSCI.4578-08.2009.

Neural activity associated with the passive prediction of ambiguity and risk for aversive events

Affiliations
Comparative Study

Neural activity associated with the passive prediction of ambiguity and risk for aversive events

Dominik R Bach et al. J Neurosci. .

Abstract

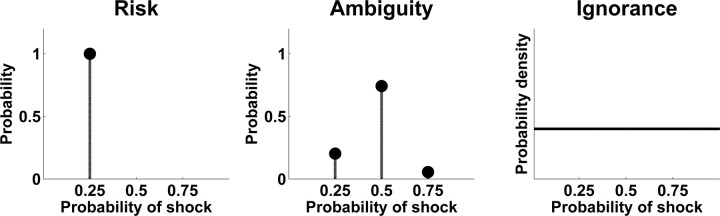
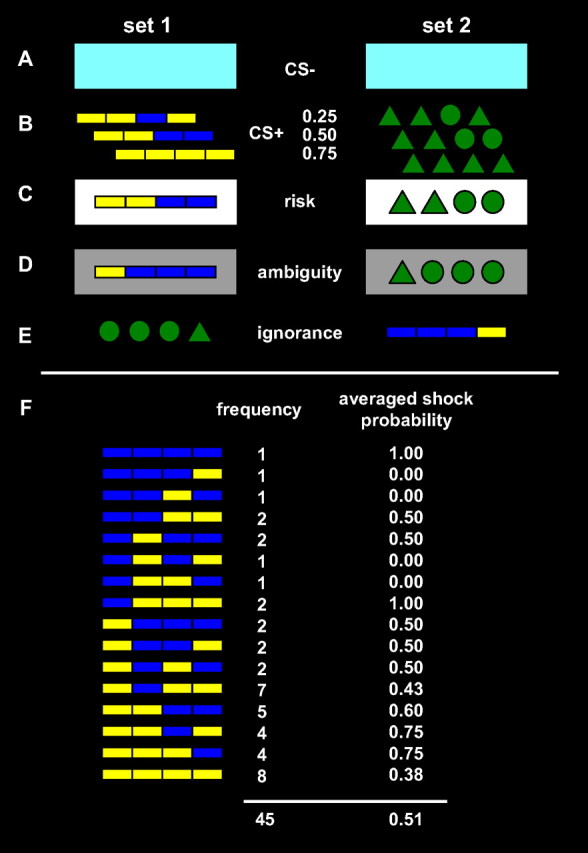
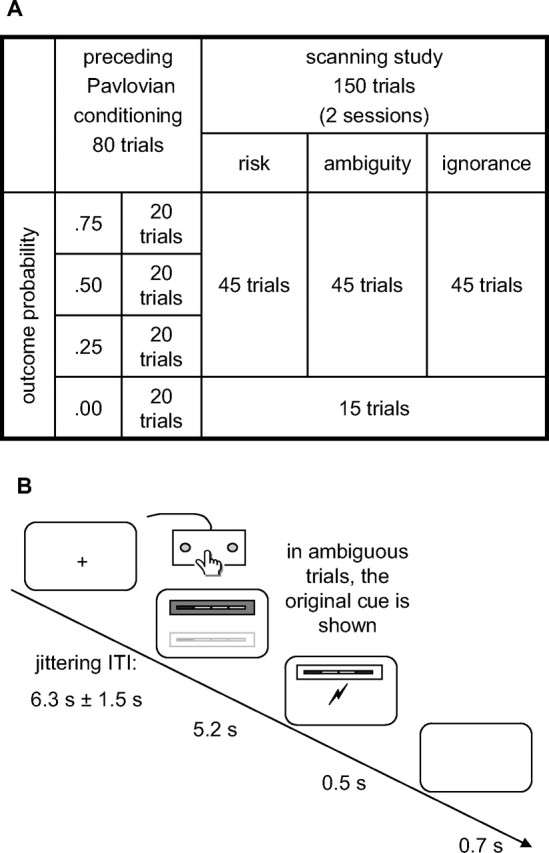
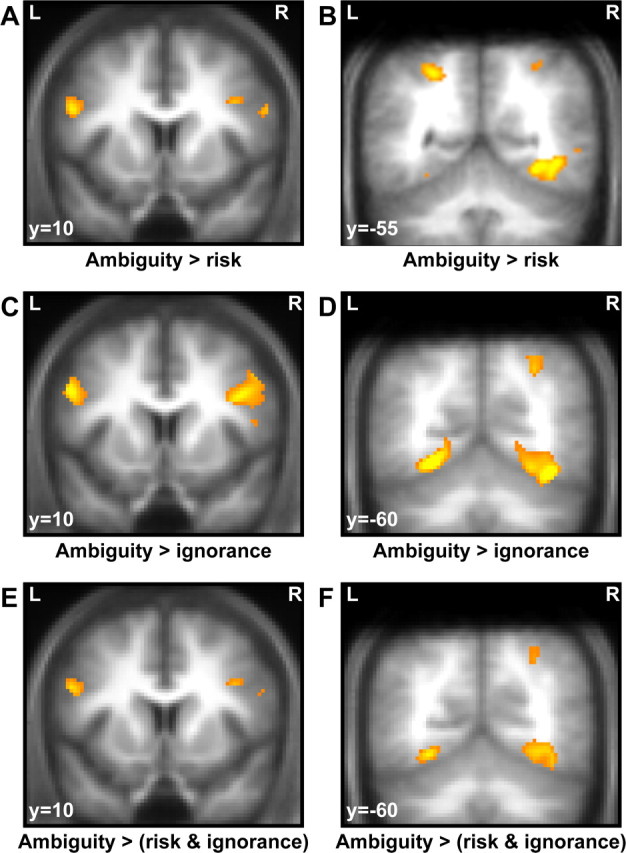
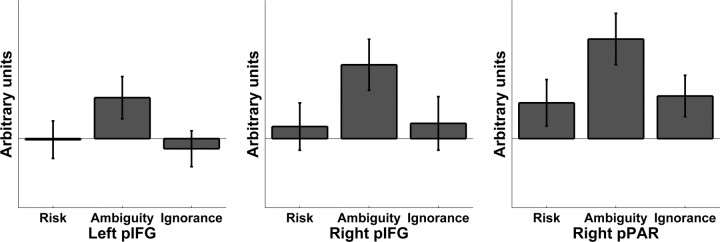
In economic decision making, outcomes are described in terms of risk (uncertain outcomes with certain probabilities) and ambiguity (uncertain outcomes with uncertain probabilities). Humans are more averse to ambiguity than to risk, with a distinct neural system suggested as mediating this effect. However, there has been no clear disambiguation of activity related to decisions themselves from perceptual processing of ambiguity. In a functional magnetic resonance imaging (fMRI) experiment, we contrasted ambiguity, defined as a lack of information about outcome probabilities, to risk, where outcome probabilities are known, or ignorance, where outcomes are completely unknown and unknowable. We modified previously learned pavlovian CS+ stimuli such that they became an ambiguous cue and contrasted evoked brain activity both with an unmodified predictive CS+ (risky cue), and a cue that conveyed no information about outcome probabilities (ignorance cue). Compared with risk, ambiguous cues elicited activity in posterior inferior frontal gyrus and posterior parietal cortex during outcome anticipation. Furthermore, a similar set of regions was activated when ambiguous cues were compared with ignorance cues. Thus, regions previously shown to be engaged by decisions about ambiguous rewarding outcomes are also engaged by ambiguous outcome prediction in the context of aversive outcomes. Moreover, activation in these regions was seen even when no actual decision is made. Our findings suggest that these regions subserve a general function of contextual analysis when search for hidden information during outcome anticipation is both necessary and meaningful.


Figures

Figure 1.
Figure 1.
Examples for outcome prediction after risky, ambiguous, or ignorance cues, visualized by a second-order distribution of outcome probabilities. In the risk condition, prediction of outcome probability corresponds to a point estimate (left). In ambiguous trials, outcome probabilities can be predicted using a second-order distribution, thus rendering outcome predictions probabilistic. Ignorance cues convey no information about outcomes, the outcome probability could therefore have any value, and its prediction corresponds to a uniform distribution.
Figure 2.
Figure 2.
Stimulus set 1 (left) and 2 (right) each of which were used on half of the participants to exclude condition effects due to simple graphical differences. A, CS− that was unchanged throughout the experiment, both in the preceding learning task and at test. B, Three CS+ that were used in the preceding learning task with different CS–UCS contingencies of 0.25, 0.50, and 0.75 as indicated. C, Risk condition used the three original CS+ cues and was signaled by a white frame around the original CS+. D, Example for an ambiguous stimulus, derived from stimulus C by flipping one of its information bits. The ambiguity condition was signaled by a gray frame around the degraded CS+. E, Example for a novel stimulus, corresponding to stimulus D by exchanging colors and geometric symbols, and reversing its information bits from left to right. F, All 16 possible ambiguous cues from set 1 (similarly for set 2 with geometric symbols instead of color bars). Each cue was surrounded by a gray frame (omitted in the figure). For each cue, its frequency during the whole experiment is indicated as well as the probability of electric shock after this cue, averaged over the whole experiment. Both frequency and shock probability were determined by the chance that this cue was derived from any of the three underlying risky cues, given a noise rate of 0.2 per information bit.
Figure 3.
Figure 3.
A, Study design. After an initial pavlovian conditioning task with one CS− and three CS+ indicating three different outcome contingencies of 0.25, 0.5, and 0.75, these CS+ were degraded in an ambiguity condition to resemble the original CS+ but allow no accurate prediction of outcomes. This was explained to participants as “noisy reception” and indicated by a gray frame. The original cues were shown in a risk condition as indicated by a white frame. In an ignorance condition, completely novel stimuli served as control. Additionally, the CS− was interleaved and served as internal baseline. B, Intratrial timeline. Each cue was shown for 5.2 s, during which participants had to respond to its position on the screen (above or below the screen center). Then, the outcome was indicated for 0.5 s and delivered. In ambiguous trials, the underlying original CS+ was shown together with the outcome indication. ITI, Intertrial interval.
Figure 4.
Figure 4.
BOLD responses to ambiguous cues, compared with risky or ignorance cues. Clusters are overlaid on a mean T1-weighted image from all participants, and displayed at a voxel-level threshold of p < 0.001 (uncorrected) and small-volume correction with regard to peak coordinates of previous studies as indicated in the methods section. A, Bilateral pIFG responses to ambiguous compared with risky cues. B, Bilateral pPAR and occipital responses to ambiguous compared with risky cues. C, Bilateral pIFG responses to ambiguous compared with ignorance cues. D, Right pPAR and bilateral occipital responses to ambiguous compared with ignorance cues. E, Bilateral pIFG responses to ambiguous compared with both risky and ignorance cues (conjunction analysis, testing against conjunction null). F, Right pPAR and bilateral occipital responses to ambiguous compared with both risky and ignorance cues (conjunction analysis, testing against conjunction null).
Figure 5.
Figure 5.
Parameter estimates for the three conditions risk, ambiguity, and ignorance, contrasted with the CS− that served as internal baseline. For each participant, estimates were averaged within the clusters displayed in Figure 4, E and F. Values are stated in arbitrary units (mean across participants ± SE).

References

    1. Andersson JL, Hutton C, Ashburner J, Turner R, Friston K. Modeling geometric deformations in EPI time series. Neuroimage. 2001;13:903–919. - PubMed
    1. Becker SW, Brownson FO. What price ambiguity? Or the role of ambiguity in decision making. J Polit Econ. 1964;72:62–73.
    1. Bernoulli D. Specimen theoriae novae de mensura sortis. Commentarii Academiae Scientiarum Imperialis Petropolitanae. 1738;5:175–192.
    1. Büchel C, Morris J, Dolan RJ, Friston KJ. Brain systems mediating aversive conditioning: an event-related fMRI study. Neuron. 1998;20:947–957. - PubMed
    1. Camerer C. Individual decision making. In: Kagel JH, Roth AE, editors. Handbook of experimental economics. Princeton: Princeton UP; 1995. pp. 587–704.

Publication types

LinkOut - more resources