Comparative Study
. 2009 Feb 11;29(6):1719-34.
doi: 10.1523/JNEUROSCI.4249-08.2009.

In vivo voltage-sensitive dye imaging in adult mice reveals that somatosensory maps lost to stroke are replaced over weeks by new structural and functional circuits with prolonged modes of activation within both the peri-infarct zone and distant sites

Affiliations
Comparative Study

In vivo voltage-sensitive dye imaging in adult mice reveals that somatosensory maps lost to stroke are replaced over weeks by new structural and functional circuits with prolonged modes of activation within both the peri-infarct zone and distant sites

Craig E Brown et al. J Neurosci. .

Abstract

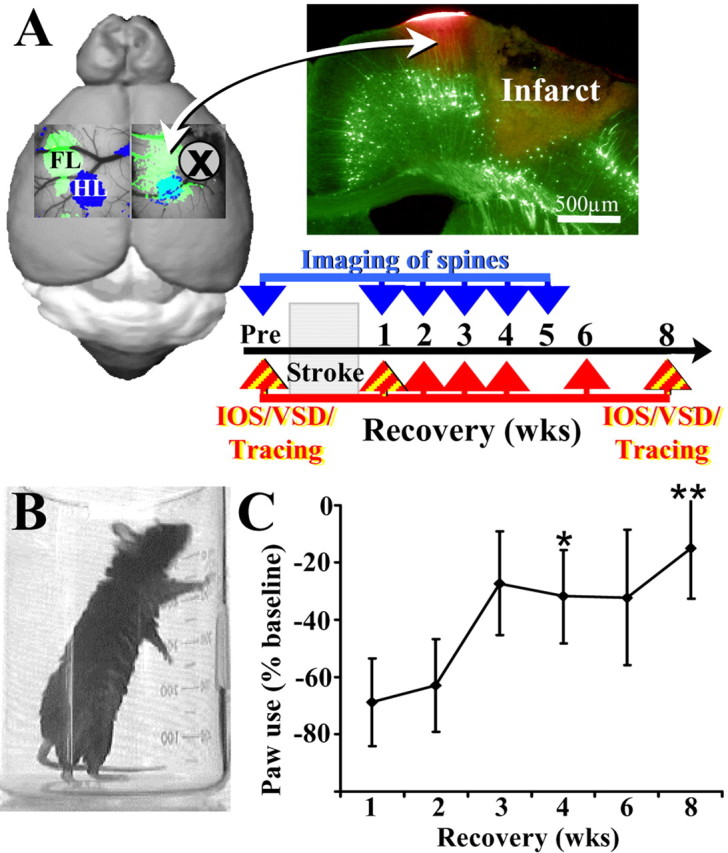
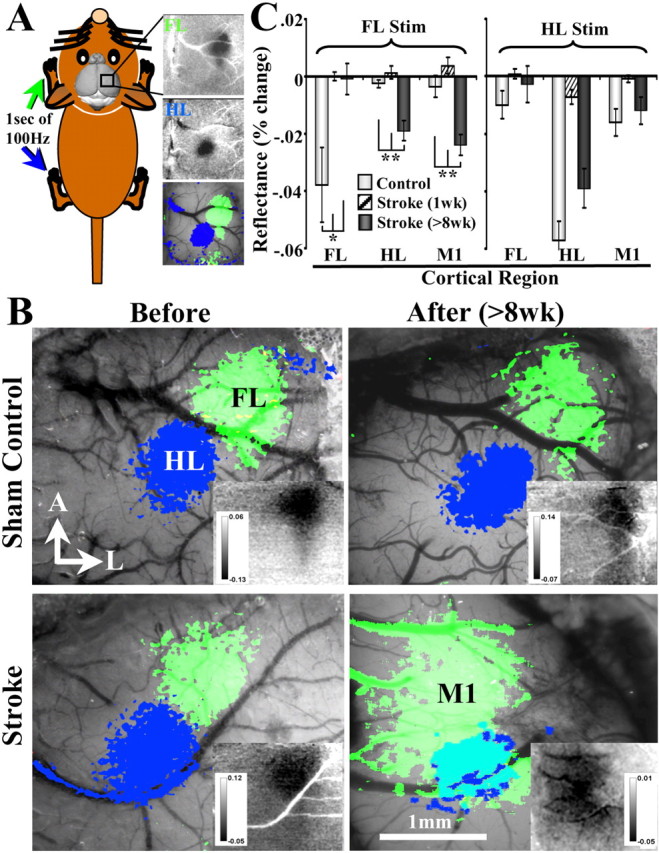
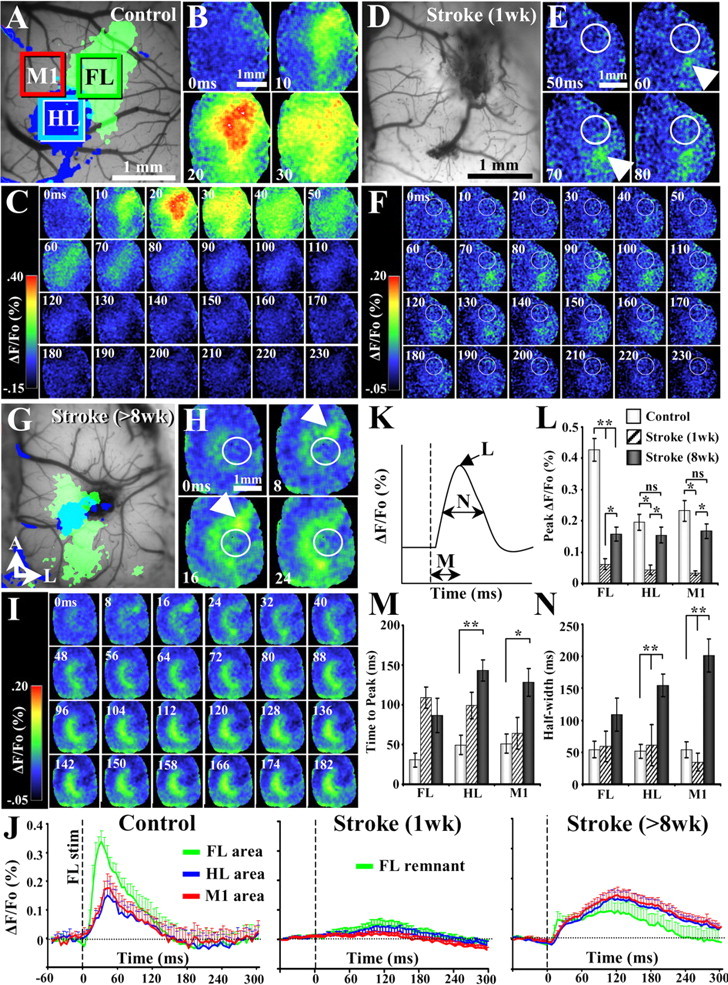
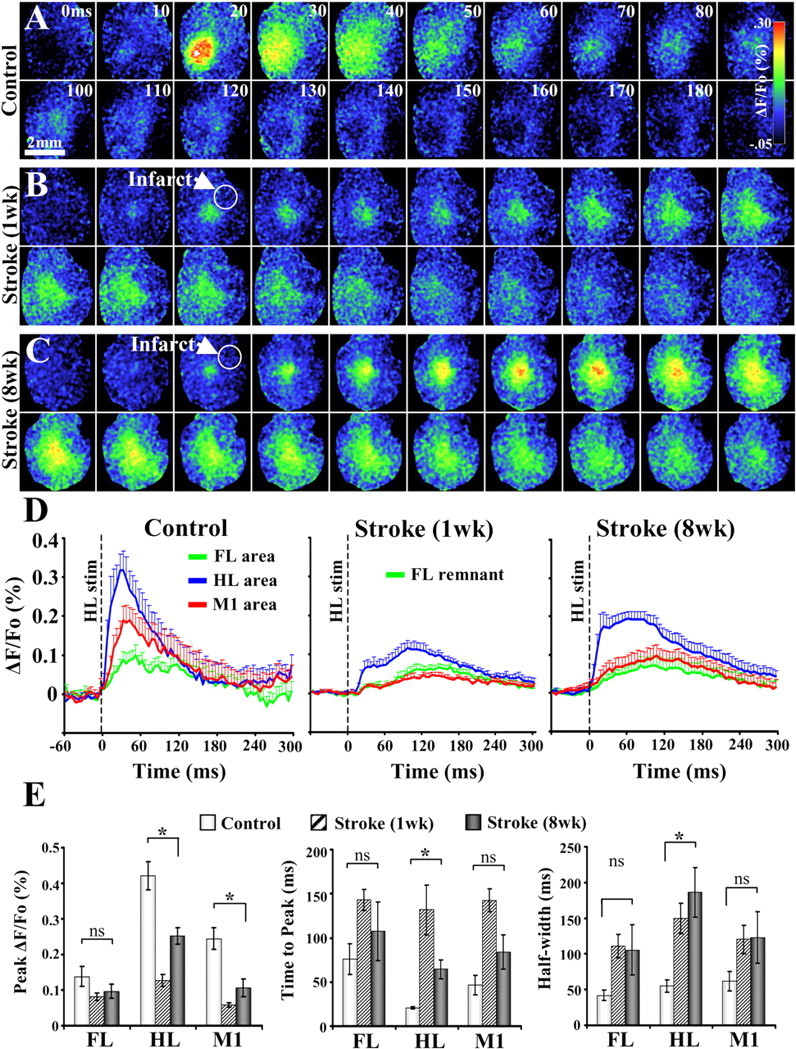
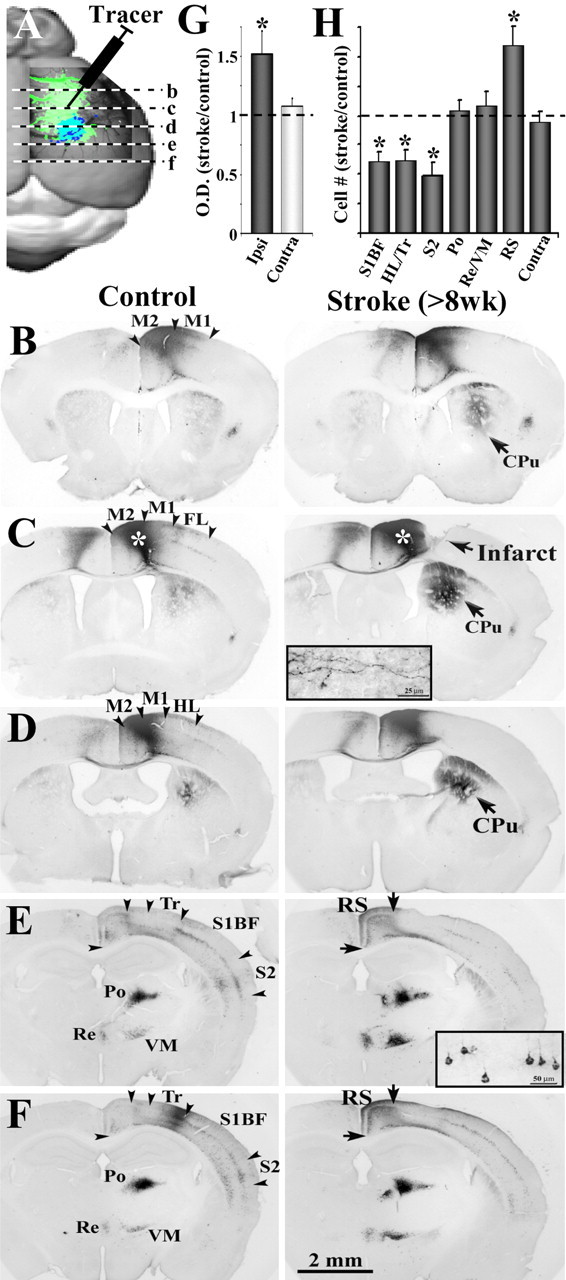
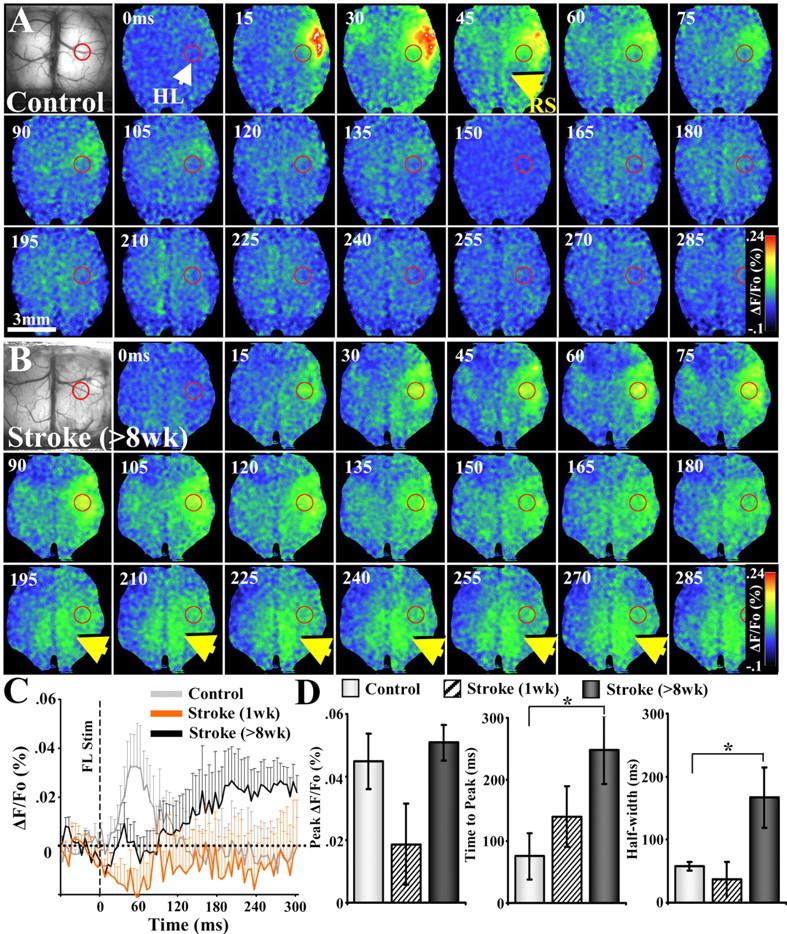
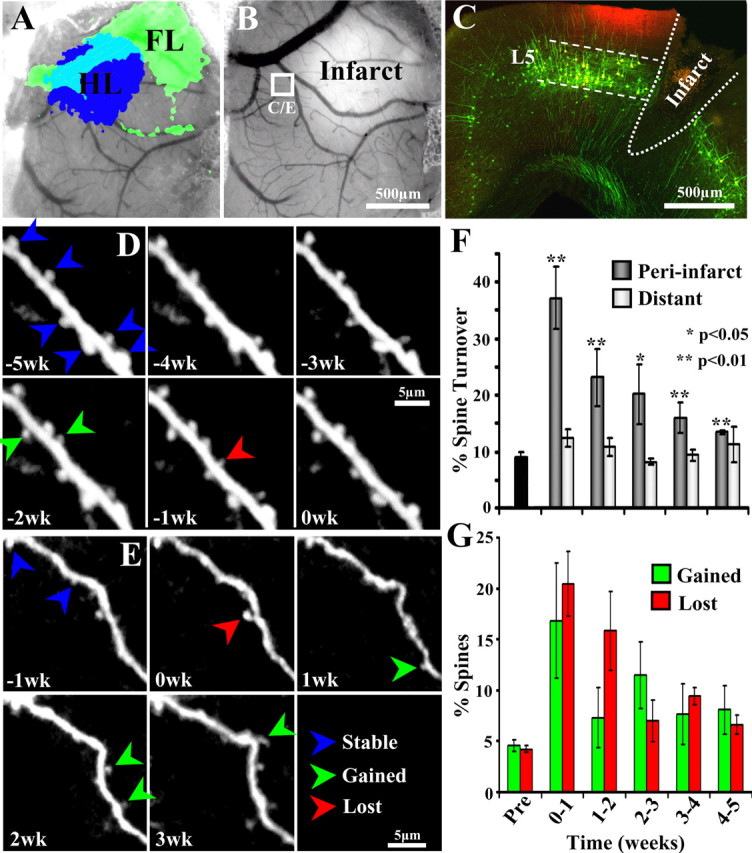
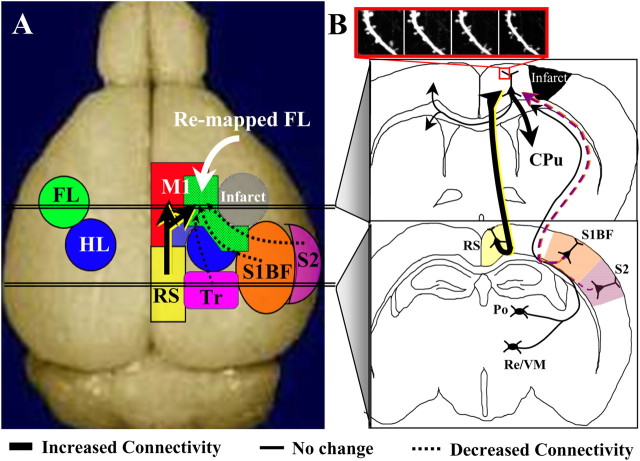
After brain damage such as stroke, topographically organized sensory and motor cortical representations remap onto adjacent surviving tissues. It is conceivable that cortical remapping is accomplished by changes in the temporal precision of sensory processing and regional connectivity in the cortex. To understand how the adult cortex remaps and processes sensory signals during stroke recovery, we performed in vivo imaging of sensory-evoked changes in membrane potential, as well as multiphoton imaging of dendrite structure and tract tracing. In control mice, forelimb stimulation evoked a brief depolarization in forelimb cortex that quickly propagated to, and dissipated within, adjacent motor/hindlimb areas (<100 ms). One week after forelimb cortex stroke, the cortex was virtually unresponsive to tactile forelimb stimulation. After 8 weeks recovery, forelimb-evoked depolarizations reemerged with a characteristic pattern in which responses began within surviving portions of forelimb cortex (<20 ms after stimulation) and then spread horizontally into neighboring peri-infarct motor/hindlimb areas in which depolarization persisted 300-400% longer than controls. These uncharacteristically prolonged responses were not limited to the remapped peri-infarct zone and included distant posteromedial retrosplenial cortex, millimeters from the stroke. Structurally, the remapped peri-infarct area selectively exhibited high levels of dendritic spine turnover, shared more connections with retrosplenial cortex and striatum, and lost inputs from lateral somatosensory cortical regions. Our findings demonstrate that sensory remapping during stroke recovery is accompanied by the development of prolonged sensory responses and new structural circuits in both the peri-infarct zone as well as more distant sites.


Figures

Figure 1.
Figure 1.
Overview of experiments examining the neurobiological mechanisms of stroke recovery. A, Before and after induction of photothrombotic stroke in the right FL (green area in diagram), we examined functional (using IOS or VSD imaging) and structural changes (using tract tracing or in vivo imaging of dendritic spines) in the peri-infarct cortex over several weeks while the animal was in the process of stroke recovery. Photomicrograph of a coronal section from a YFP-labeled transgenic mouse showing the photothrombotic infarction and the peri-infarct region demarcated in red with DiI. B, Photograph showing a mouse 1 week into recovery from stroke using its un-impaired (right) forelimb for support during upright rears in the cylinder test of forelimb function. C, Graph showing the percentage change in usage of the impaired forelimb (i.e., contralateral to stroke) at different time points during stroke recovery. In the first 1–2 weeks after stroke, mice rarely use the impaired left forelimb for support during vertical rears. Over the ensuing weeks, mice show a significant increase in the usage of the impaired forelimb, particularly by the end of the 8 week testing period relative to 1 week data. *p < 0.01, **p < 0.005.
Figure 2.
Figure 2.
In vivo IOS imaging reveals that behavioral recovery is associated with remapping of the forelimb representation into adjacent peri-infarct motor and hindlimb cortex. A, Diagram showing how IOS maps were generated. Maps were generated by recording the change in the reflectance of red light off the surface of the brain after mechanical stimulation of the contralateral forelimb or hindlimb (green and blue areas, respectively). Note that distinct parts of the cerebral cortex appear darker after stimulation, which corresponds with increased levels of deoxyhemoglobin. B, Images showing the functional representation of the forelimb and hindlimb before and 8 weeks after sham surgery (top) or photothrombotic stroke (bottom). Before stroke, IOS-derived maps were generated using a transcranial imaging preparation, whereas those taken at 8 weeks recovery were performed with the bone removed. The areal extent of each functional map was determined by thresholding images at two-thirds of maximal intrinsic signal amplitude. Insets in each image show raw percentage change in reflectance after forelimb stimulation. Notice that, in sham controls and prestroke mice, the functional representation of the forelimb was reliably located at a 45° angle from the hindlimb, which did not change 8 weeks after sham surgery. Eight weeks after stroke, the functional representation of the forelimb shifted into the peri-infarct M1 and HL. C, Graphs summarizing quantitative changes in cortical responsiveness (as indicated by more negative reflectance values) to stimulation of forelimb or hindlimb in controls, 1 and 8 weeks after stroke. In controls, forelimb and hindlimb areas responded selectively to stimulation of their respective limbs. One week after stroke, forelimb responses were virtually absent, although a small response to hindlimb stimulation could be detected in the hindlimb cortex. Eight weeks after stroke, motor and hindlimb cortical areas showed a significant hemodynamic response to forelimb stimulation. Cortical responses to hindlimb stimulation dropped significantly at 1 week but were not significantly different from control levels at 8 weeks recovery. *p < 0.05, **p < 0.005.
Figure 3.
Figure 3.
VSD imaging reveals progressive changes in the spatiotemporal dynamics of forelimb-evoked cortical responses after stroke. A, D, G, Before VSD imaging, IOS imaging was used to visualize the functional representation of the forelimb and hindlimb in controls (A) and after 1 week (D) and 8 weeks (G) recovery from stroke. However, because of the fact that forelimb-evoked IOS signals at 1 week recovery were exceedingly difficult to obtain, only the surface of the brain is shown at this time point. B, C, VSD imaging of cortical responses to forelimb stimulation (one 5 ms tap per trial) in a control mouse. The earliest VSD response originates in the center of the forelimb and quickly spreads to adjacent cortical areas. Note the close correspondence between IOS (A) and VSD-derived maps of the forelimb. E, F, At 1 week recovery, the cortex was mostly unresponsive to forelimb stimulation except in the surviving portion of forelimb cortex posterior to the infarct (infarct denoted by white circle). H, I, After at least 8 weeks recovery from stroke, the earliest VSD signal arises from the remaining piece of the forelimb cortex (indicated by white arrow in H), which then spreads horizontally to motor and hindlimb cortical areas, which are medial and posterior to the infarct (infarct denoted by white circle). Note that, after stroke, motor and hindlimb areas show very prolonged responses to forelimb stimulation. J, Plots summarizing average forelimb, hindlimb, and motor cortical responses (plots derived from green, blue, and red boxes shown in A) to stimulation of the forelimb in controls and stroke-recovered mice at 1 and 8 weeks. Note that, in controls (n = 9 mice), responses in all three areas were relatively brief, peaking within the first 50 ms and rapidly decayed. One week after stroke (n = 6 mice), cortical responses were barely detectable. However, after 8 weeks recovery (n = 6 mice), the amplitude of motor and hindlimb area responses returned to near control levels. Furthermore, peri-infarct motor and hindlimb responses to forelimb stimulation persisted for considerably longer periods of time relative to controls. K–N, Quantification of VSD signal response amplitude (L), time-to-peak (M), and duration (N; time spent at half-maximal response amplitude) in controls and stroke-recovered mice at 1 and 8 weeks. *p < 0.01, **p < 0.001.
Figure 4.
Figure 4.
VSD imaging of cortical responses to hindlimb stimulation. A–C, Montages showing the spatiotemporal dynamics of cortical responses to hindlimb stimulation (average of 10–20 trials, 1 5 ms tap delivered per trial) in controls (A) and 1 week (B) and 8 weeks (C) after stroke. Scale bar, 2 mm. D, Average forelimb (green), hindlimb (blue), and motor (red) cortical responses to hindlimb stimulation in controls (n = 9 mice) and 1 week (n = 6 mice) and 8 weeks (n = 6 mice) after stroke. E, Quantification of hindlimb-evoked VSD cortical responses in controls and after stroke. Our analysis showed that stroke in the forelimb cortex caused significant changes in the peak amplitude, time-to-peak, and duration (i.e., half-width) of responses in hindlimb cortex. *p < 0.01.
Figure 5.
Figure 5.
Tracing new patterns of neuronal connectivity in the functionally reorganized forelimb representation. A, Diagram showing the injection site of the neuronal tracer CtB and the relative anteroposterior position of coronal sections shown in B–F. B–F, Light photomicrographs showing the distribution of labeled axons and cell bodies in coronal sections, after an injection of CtB into the motor cortex of controls and after 8 weeks recovery (see white asterisks over darkly stained area in C). Insets show higher-magnification images of anterograde labeling of axons in the striatum (C) and retrograde labeling of cell bodies in the cortex (E). In general, both control and stroke recovered mice showed CtB-labeled axons and somata in the ipsilateral and contralateral M1 and M2, the primary somatosensory regions of the HL, Tr and whiskers (S1BF), S2, RS, and the Po, VM, and Re nucleus of the thalamus. Note that, 8 weeks after stroke, there is much greater CtB labeling in the ipsilateral striatum (CPu) and RS cortex, whereas labeling is reduced in more lateral cortical areas such as the HL/Tr, S1BF, and S2. G, Relative to controls, the optical density of axonal labeling in the striatum was significantly greater in the ipsilateral but not contralateral hemisphere after stroke. H, Quantification of retrogradely labeled cell bodies in stroke-recovered mice relative to controls. After stroke, there were significantly fewer labeled cell bodies in the HL/Tr, S1BF, and S2 but more labeled somata in the RS cortex. No change in cell labeling was found in the thalamic nuclei or homotopic regions of the contralateral cortex. *p < 0.05.
Figure 6.
Figure 6.
Bihemispheric VSD imaging of forelimb-evoked responses in control and stroke-recovered mice. A, Montage shows the timing and spread of VSD signals in a control mouse after stimulation of the left forelimb. Note the robust responses in right forelimb cortex (anterolateral to hindlimb cortex shown by a red circle) that peaks within 15–45 ms after stimulation and quickly dissipates. B, In mice that had recovered for 8 weeks, forelimb-evoked responses were especially prominent in peri-infarct motor and hindlimb areas during the first 200 ms, which was then followed by prolonged activation in the posteromedial retrosplenial cortex (see yellow arrows). C, Average forelimb-evoked VSD signals in the retrosplenial cortex of controls (n = 5) and stroke-recovered mice at 1 week (n = 6) and 8 weeks (n = 5). D, Forelimb-evoked VSD signals in the retrosplenial cortex of mice that had recovered for at least 8 weeks after stroke (>8 weeks) were shifted significantly in time and duration but not amplitude. *p < 0.05.
Figure 7.
Figure 7.
Increased rates of dendritic spine turnover in reorganized forelimb area during stroke recovery. A, IOS mapping of the forelimb and hindlimb representations through the cranial window before the induction of stroke. B, One week after focal stroke in forelimb cortex, tissue in the infarct core appears brighter than adjacent surviving tissue. C, Confocal images showing the approximate location of longitudinal imaging (boxed area in B marked with DiI, appears red) in a coronal section of a YFP transgenic mouse. Note that YFP-labeled dendrites originated almost exclusively from layer 5 of the cortex. D, In vivo time-lapse images of a dendrite imaged for 5 weeks before the induction of stroke. The “0wk” time point represents data taken 1 h before the induction of stroke. E, Time-lapse images of a peri-infarct dendrite (indicated by white box in B) imaged 1 week before and 3 weeks after stroke. Note that more dendritic spines are formed (green arrowheads) and lost (red arrowheads) after stroke. F, Graph shows average weekly rates of dendritic spine turnover (sum of percentage spines gained and lost relative to stable spines) before (Pre) and several weeks after stroke. Spine turnover rates were elevated specifically within the peri-infarct cortex (∼0.18 ± 0.01 mm) but not in more distant cortex (∼0.7 ± 0.08 mm). G, Graph showing percentage spines gained or lost in the peri-infarct region. Both spine formation and elimination rates are similarly affected by stroke. *p < 0.05; **p < 0.01.
Figure 8.
Figure 8.
Summary of new functional and structural circuits, viewed from the dorsal (A) or coronal (B) plane. Several weeks after focal ischemic stroke (gray area in right hemisphere of A), forelimb-evoked responses reemerge in adjacent peri-infarct motor and hindlimb cortical areas (note the shaded green area overlapping with blue and red zones that correspond with hindlimb and motor areas, respectively). Longitudinal two-photon imaging indicated that layer 5 apical dendrites in the reorganized zone were sites of heightened dendritic spine turnover (see inset outlined in red box in B). Tracing of neuronal connectivity in the reorganized forelimb area revealed that it had lost inputs from more lateral primary and secondary somatosensory cortical regions (see dotted arrows from orange and purple zones) but gained connections from the retrosplenial cortex (thick arrow from yellow zone in A and B) and sent more output projections to the ipsilateral striatum (thick arrow entering CPu). In contrast, connectivity with the contralateral cerebral cortex/striatum, as well as the ipsilateral thalamus did not change significantly (see thin black arrows).

References

    1. Alloway KD, Lou L, Nwabueze-Ogbo F, Chakrabarti S. Topography of cortical projections to the dorsolateral neostriatum in rats: multiple overlapping sensorimotor pathways. J Comp Neurol. 2006;499:33–48. - PubMed
    1. Armstrong-James M, Welker E, Callahan CA. The contribution of NMDA and non-NMDA receptors to fast and slow transmission of sensory information in the rat SI barrel cortex. J Neurosci. 1993;13:2149–2160. - PMC - PubMed
    1. Berger T, Borgdorff A, Crochet S, Neubauer FB, Lefort S, Fauvet B, Ferezou I, Carleton A, Lüscher HR, Petersen CC. Combined voltage and calcium epifluorescence imaging in vitro and in vivo reveals subthreshold and suprathreshold dynamics of mouse barrel cortex. J Neurophysiol. 2007;97:3751–3762. - PubMed
    1. Biernaskie J, Szymanska A, Windle V, Corbett D. Bi-hemispheric contribution to functional motor recovery of the affected forelimb following focal ischemic brain injury in rats. Eur J Neurosci. 2005;21:989–999. - PubMed
    1. Blake DT, Hsiao SS, Johnson KO. Neural coding mechanisms in tactile pattern recognition: the relative contributions of slowly and rapidly adapting mechanoreceptors to perceived roughness. J Neurosci. 1997;17:7480–7489. - PMC - PubMed

Publication types

LinkOut - more resources