Comparative Study
. 2009 Feb 11;29(6):1805-16.
doi: 10.1523/JNEUROSCI.4599-08.2009.

Hippocampal and cognitive aging across the lifespan: a bioenergetic shift precedes and increased cholesterol trafficking parallels memory impairment

Affiliations
Comparative Study

Hippocampal and cognitive aging across the lifespan: a bioenergetic shift precedes and increased cholesterol trafficking parallels memory impairment

Inga Kadish et al. J Neurosci. .

Abstract

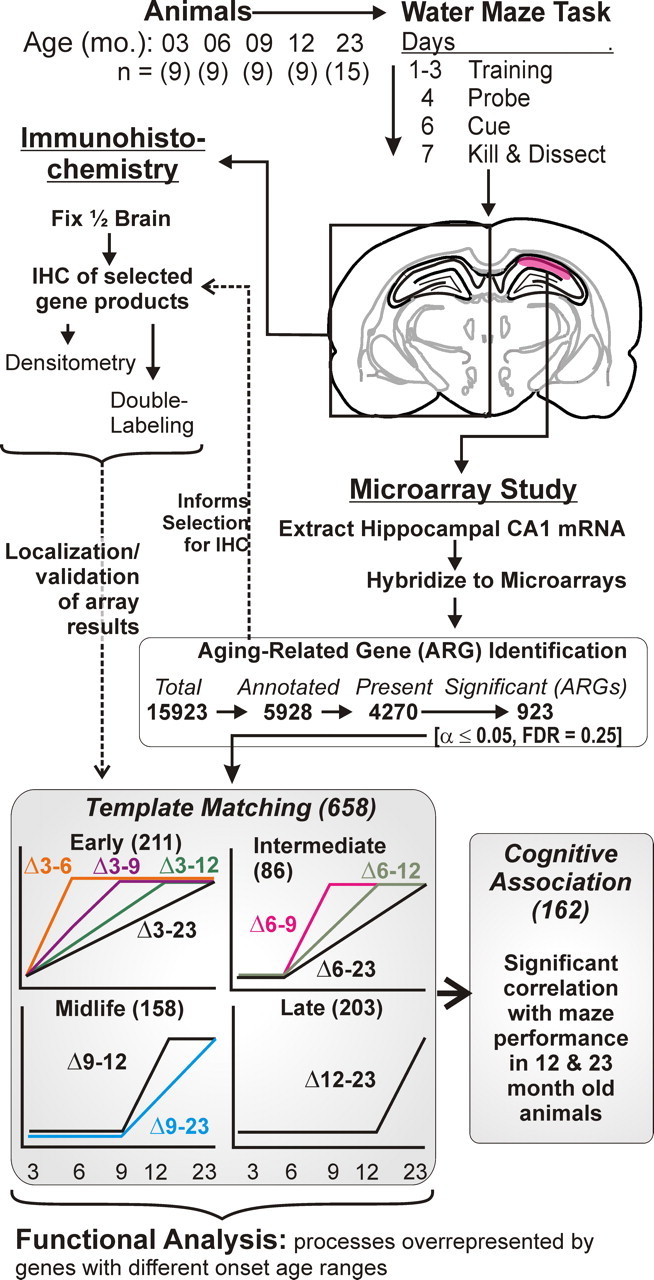
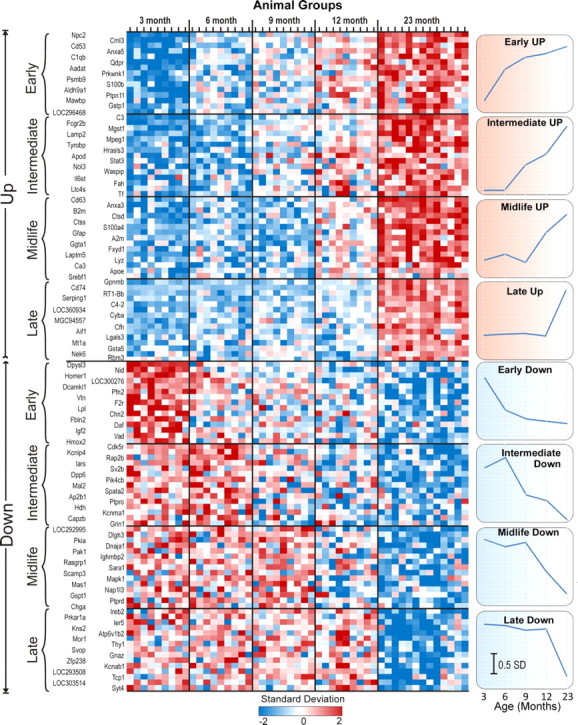
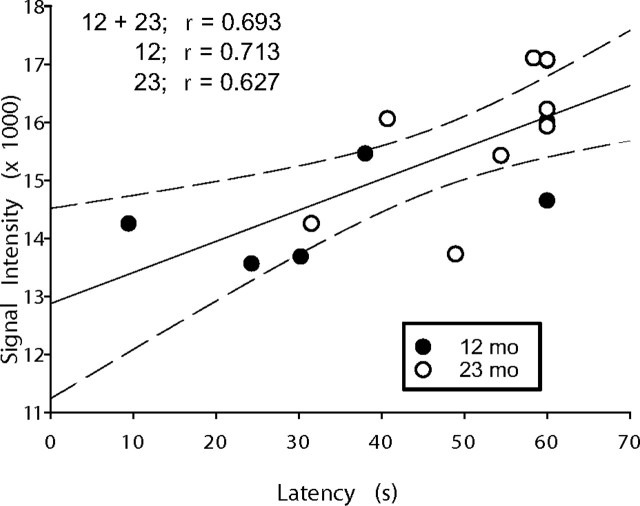
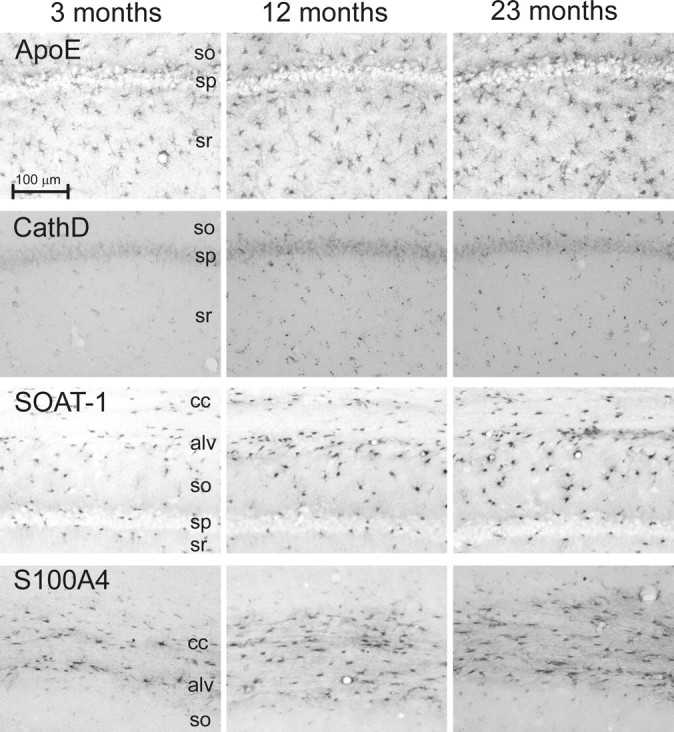
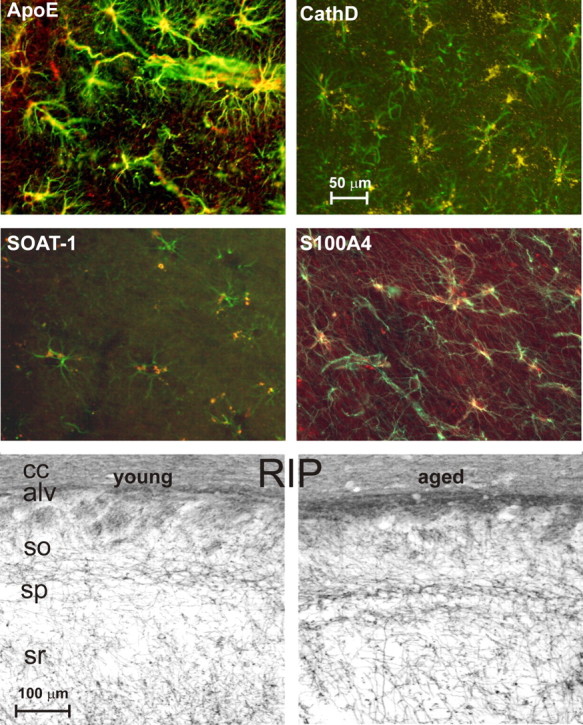
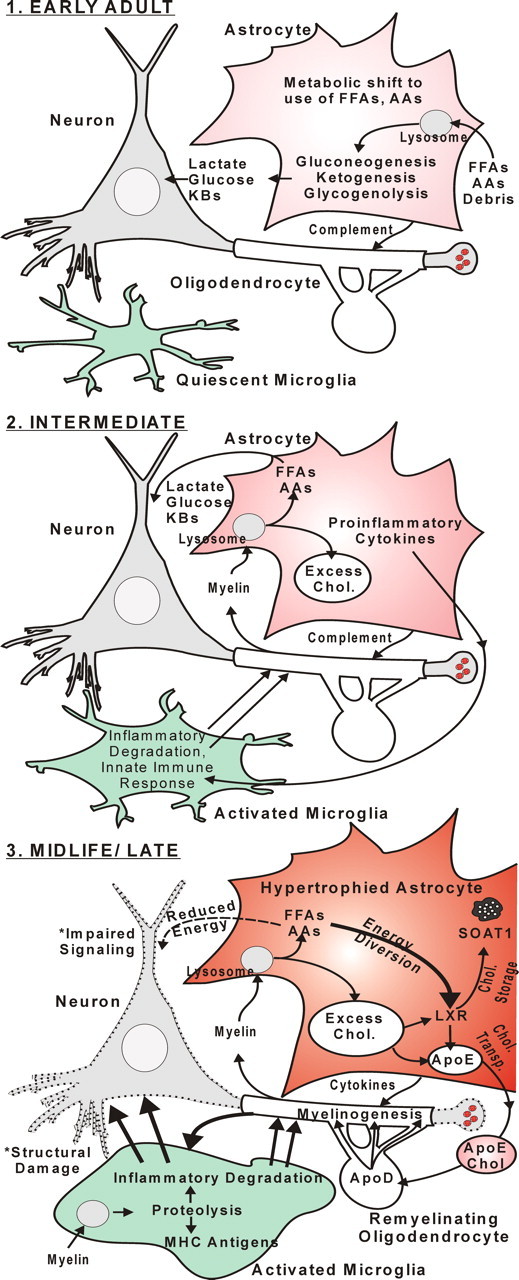
Multiple hippocampal processes and cognitive functions change with aging or Alzheimer's disease, but the potential triggers of these aging cascades are not well understood. Here, we quantified hippocampal expression profiles and behavior across the adult lifespan to identify early aging changes and changes that coincide with subsequent onset of cognitive impairment. Well powered microarray analyses (N = 49 arrays), immunohistochemistry, and Morris spatial maze learning were used to study male F344 rats at five age points. Genes that changed with aging (by ANOVA) were assigned to one of four onset age ranges based on template pattern matching; functional pathways represented by these genes were identified statistically (Gene Ontology). In the earliest onset age range (3-6 months old), upregulation began for genes in lipid/protein catabolic and lysosomal pathways, indicating a shift in metabolic substrates, whereas downregulation began for lipid synthesis, GTP/ATP-dependent signaling, and neural development genes. By 6-9 months of age, upregulation of immune/inflammatory cytokines was pronounced. Cognitive impairment first appeared in the midlife range (9-12 months) and coincided and correlated primarily with midlife upregulation of genes associated with cholesterol trafficking (apolipoprotein E), myelinogenic, and proteolytic/major histocompatibility complex antigen-presenting pathways. Immunolabeling revealed that cholesterol trafficking proteins were substantially increased in astrocytes and that myelination increased with aging. Together, our data suggest a novel sequential model in which an early-adult metabolic shift, favoring lipid/ketone body oxidation, triggers inflammatory degradation of myelin and resultant excess cholesterol that, by midlife, activates cholesterol transport from astrocytes to remyelinating oligodendrocytes. These processes may damage structure and compete with neuronal pathways for bioenergetic resources, thereby impairing cognitive function.


Figures

Figure 1.
Figure 1.
Overview of experimental protocol and microarray analysis procedure. Top, Animals (N = 9–15) from five age groups (3–23 months) were tested on the Morris water maze. Top middle, Brains were removed and one hemisphere was used for immunohistochemistry, and the hippocampal CA1 region (red) of the other hemisphere was subdissected and used for microarray studies. Bottom middle, For microarray analyses, genes were filtered to exclude ESTs and absence calls. The remaining genes/probe sets were tested across age groups by one-way ANOVA. Genes significant by this procedure were designated ARGs. Dashed arrow from ARG identification to selected IHC analyses: ARG identification was used to inform selection for immunohistochemical analysis. Bottom, Based on highest correlation with 1 of 10 idealized templates, ARGs were assigned to one of four basic ages of onset (see Materials and Methods). Note that only upregulated templates were used; downregulated ARGs within each template were identified based on negative, rather than positive, correlations (see Materials and Methods). Templates were then grouped according to onset age ranges (early, intermediate, midlife, and late) determined from the age point at which the initial deflection in expression from the 3 month group was detected. For all ARGs assigned an onset range, correlation of gene expression and MWM performance in the 12- and 23-month-old animals was tested (Pearson's test). Functional process overrepresentation analysis was performed for ARGs in each onset age range using EASE/DAVID analysis procedures interrogating the Gene Ontology (see Materials and Methods).
Figure 2.
Figure 2.
Heat map of aging-related genes with assigned onset age. Individual subjects are listed in columns and grouped by age, and genes are listed in rows and grouped by change direction and age of onset. For each of the four age-of-onset ranges, the 15 most significant upregulated (top) and downregulated (bottom) gene symbols are displayed. The expression level of each ARG is standardized across all subjects. This results in a mean of 0, and each individual subject's ARG expression level is expressed in SDs from that mean level. This does not affect statistical results but allows genes with different signal intensity ranges and similar patterns of expression to be displayed on the same heat map. Results for each ARG shown are color coded from low (blue, 2 SDs below mean), through average (white, 0 SDs from mean) to high (red, 2 SDs above mean; see color bar) expression. Right, Standardized averages for all ARGs in each upregulated and downregulated age range of onset (note that these averages use all of the genes assigned to the range rather than just the 15 displayed in the figure). Points represent mean ± SEM (error bars plotted but too small to see). Scale bar, 0.5 SDs.
Figure 3.
Figure 3.
Apoe mRNA expression positively correlated with MWM impairment. Individual microarray-derived Apoe gene expression measures (y-axis) are plotted as a function of retention latency during water maze performance (x-axis) for 12- and 23-month-old animals. There was a significant (p = 0.003; Pearson's test) correlation across 12 plus 23 month subjects (solid line indicates regression, with dashed lines representing 95% confidence intervals). Correlations within the 12- and 23-month-old groups separately were also significant (12 months, p = 0.04; 23 months, p = 0.05). r values for correlations within 12 months, 23 months, and 12 plus 23 months combined data are shown in the graph.
Figure 4.
Figure 4.
IHC patterns of selected proteins. Micrographs from brain specimens contralateral to those used for microarray for four proteins, ApoE, CathD, SOAT1, and S100A4 across three ages (3, 12, and 23 months) are shown. These proteins were selected for validation of aging differences and identification of cell-type localization based on relevance to astrocyte reactivity and cholesterol trafficking (Table 3). All were significantly upregulated by semiquantitative IHC (p < 0.05; see Results). Note preferential upregulation of SOAT1 and S100A4 in astrocytes near or in white matter tracts (alv and cc). sp, Stratum pyramidale; so, stratum oriens; sr, stratum radiatum; cc, corpus callosum; alv, alveus. Scale bar, 100 μm.
Figure 5.
Figure 5.
Double-labeled colocalization with astrocytic GFAP. Top four panels, Double-labeled images from brain specimens contralateral to the ones used for microarray analysis showing overlapping expression (in yellow) of GFAP (an astrocyte marker, in green) with ApoE, CathD, SOAT-1, or S100A4 staining (red). ApoE, CathD, and SOAT-1 specimens are from dorsal hippocampus, and S100A4 staining is from corpus callosum. Note the extensive distribution of APOE in astrocyte somata and blood vessel end feet, the more punctuate distribution of CathD and SOAT1, likely in lysosomes and storage granules, and S100A4 widely distributed in cell anatomical processes. Bottom two panels, Photomicrographs of dorsal hippocampal specimens contralateral to those used for microarray stained with RIP, a myelin/oligodendrocyte marker. Note the widely increased staining density with age. Semiquantitative analysis also showed that RIP staining was significantly increased across age (p < 0.05) (see Results). sp, Stratum pyramidale; so, stratum oriens; sr, stratum radiatum; cc, corpus callosum; alv, alveus.
Figure 6.
Figure 6.
Schematic model of sequential hippocampal aging changes. EARLY ADULT, Early age-related alterations in hippocampal gene expression suggest an aging-related metabolic shift from glucose to FFAs/AAs/KBs as predominant fuel source. This shift appears orchestrated primarily in astrocytes with upregulation of genes in pathways for lipid and protein catabolism and upregulation of the lysosomal pathway. INTERMEDIATE, Astrocytes generate increased FFAs and AAs by releasing cytokines and complement components that trigger microglial inflammatory degradation of the lipid- and protein-rich myelin sheath, generating excess cholesterol as a byproduct. MIDLIFE/LATE, Increased excess cholesterol triggers upregulation of astrocytic ApoE, cholesterol trafficking, and myelinogenic programs that enable incorporation of excess cholesterol from ApoE-containing lipoproteins into remyelinating oligodendrocytes for storage/disposal. Elevated proteolysis activates antigen-presenting pathways in microglia. Together, the increased inflammation and energy-expensive glial activation induce damage in neurons (dashed outline) and compete for energy with neuronal signaling pathways, resulting in cognitive impairment.

References

    1. Abildayeva K, Jansen PJ, Hirsch-Reinshagen V, Bloks VW, Bakker AH, Ramaekers FC, de Vente J, Groen AK, Wellington CL, Kuipers F, Mulder M. 24(S)-hydroxycholesterol participates in a liver X receptor-controlled pathway in astrocytes that regulates apolipoprotein E-mediated cholesterol efflux. J Biol Chem. 2006;281:12799–12808. - PubMed
    1. Ashburner M, Ball CA, Blake JA, Botstein D, Butler H, Cherry JM, Davis AP, Dolinski K, Dwight SS, Eppig JT, Harris MA, Hill DP, Issel-Tarver L, Kasarskis A, Lewis S, Matese JC, Richardson JE, Ringwald M, Rubin GM, Sherlock G. Gene ontology: tool for the unification of biology. The Gene Ontology Consortium. Nat Genet. 2000;25:25–29. - PMC - PubMed
    1. Bartzokis G, Lu PH, Mintz J. Human brain myelination and amyloid beta deposition in Alzheimer's disease. Alzheimers Dement. 2007;3:122–125. - PMC - PubMed
    1. Bi X, Yong AP, Zhou J, Gall CM, Lynch G. Regionally selective changes in brain lysosomes occur in the transition from young adulthood to middle age in rats. Neuroscience. 2000;97:395–404. - PubMed
    1. Björkhem I. Crossing the barrier: oxysterols as cholesterol transporters and metabolic modulators in the brain. J Intern Med. 2006;260:493–508. - PubMed

Publication types