. 2009 Jun;23(6):1946-57.
doi: 10.1096/fj.08-125674. Epub 2009 Feb 11.

Obesity-induced insulin resistance and hepatic steatosis are alleviated by omega-3 fatty acids: a role for resolvins and protectins

Affiliations

Obesity-induced insulin resistance and hepatic steatosis are alleviated by omega-3 fatty acids: a role for resolvins and protectins

Ana González-Périz et al. FASEB J. 2009 Jun.

Abstract

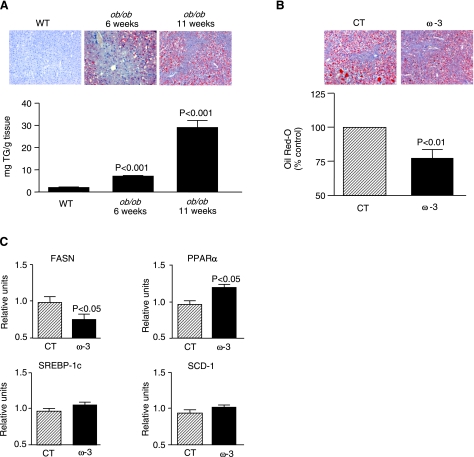
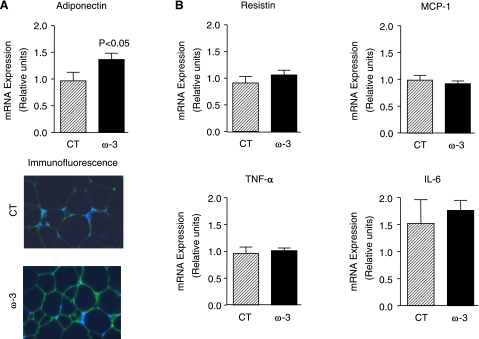
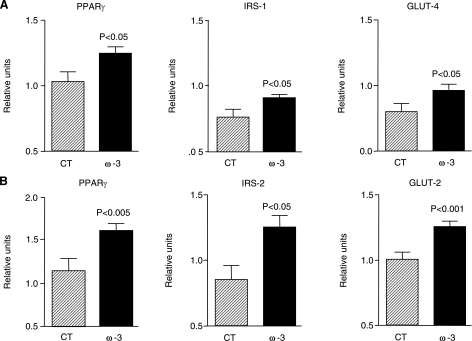
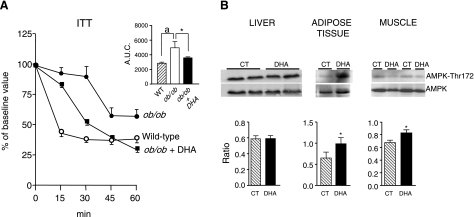
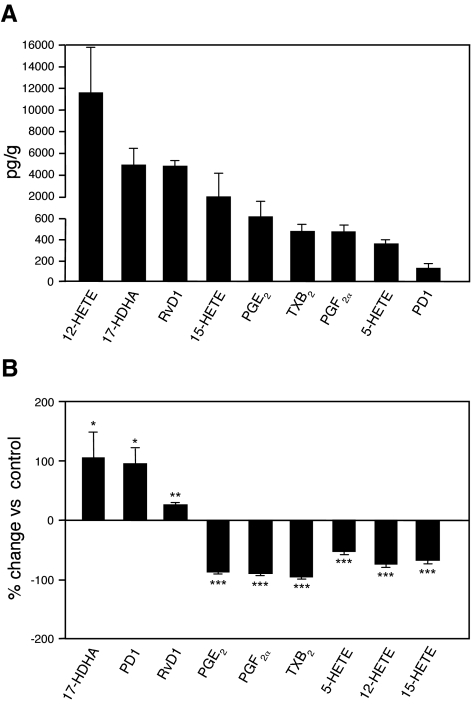
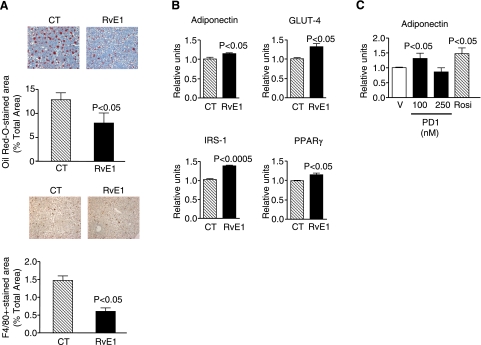
Omega-3-polyunsaturated fatty acids (omega-3-PUFAs) have well-documented protective effects that are attributed not only to eicosanoid inhibition but also to the formation of novel biologically active lipid mediators (i.e., resolvins and protectins). In this study, we examined their effects on ob/ob mice, an obesity model of insulin resistance and fatty liver disease. Dietary intake of omega-3-PUFAs had insulin-sensitizing actions in adipose tissue and liver and improved insulin tolerance in obese mice. Genes involved in insulin sensitivity (PPARgamma), glucose transport (GLUT-2/GLUT-4), and insulin receptor signaling (IRS-1/IRS-2) were up-regulated by omega-3-PUFAs. Moreover, omega-3-PUFAs increased adiponectin, an anti-inflammatory and insulin-sensitizing adipokine, and induced AMPK phosphorylation, a fuel-sensing enzyme and a gatekeeper of the energy balance. Concomitantly, hepatic steatosis was alleviated by omega-3-PUFAs. A lipidomic analysis with liquid chromatography/mass spectrometry/mass spectrometry revealed that omega-3-PUFAs inhibited the formation of omega-6-PUFA-derived eicosanoids, while triggering the formation of omega-3-PUFA-derived resolvins and protectins. Moreover, representative members of these lipid mediators, namely resolvin E1 and protectin D1, mimicked the insulin-sensitizing and antisteatotic effects of omega-3-PUFAs and induced adiponectin expression to a similar extent that of rosiglitazone, a member of the thiazolidinedione family of antidiabetic drugs. Taken together, these findings uncover beneficial actions of omega-3-PUFAs and their bioactive lipid autacoids in preventing obesity-induced insulin resistance and hepatic steatosis.


Figures

Figure 1.
Figure 1.
Hepatic steatosis in ob/ob mice is alleviated by ω-3-PUFAs. A) Representative photomicrographs of liver sections stained with Oil Red O (top) and hepatic TG levels (bottom) in liver samples from wild-type (n=3) and ob/ob mice (n=14) at different weeks of age. B) Representative photomicrographs and histomorphometrical analysis of liver sections stained with Oil Red O from ob/ob mice receiving either control (CT; n=8) or ω-3-PUFA-enriched (ω-3; n=16) diets for 5 wk. C) Expression of key genes involved in hepatic lipid metabolism (i.e., FASN, PPARα, SREBP-1c, and SCD-1) was determined by real-time RT-PCR in liver samples from ob/ob mice after receiving control or experimental diets. Results are expressed as means ± se; P values vs. wild-type (WT) group (A) or CT group (B, C).
Figure 2.
Figure 2.
Effects of ω-3-PUFAs on adipokines in adipose tissue from ob/ob mice. A) Adipose tissue was obtained from ob/ob mice after receiving either a control diet (n=8) or a diet enriched with ω-3-PUFAs (n=16) for 5 wk. Adiponectin expression was assessed by real-time-RT-PCR, and adiponectin production was assessed by immunofluorescence labeling as described in Materials and Methods. B) Expression of resistin, MCP-1, TNF-α, and IL-6 was determined by real-time-RT-PCR. Results are expressed as means ± se; P values vs. CT group.
Figure 3.
Figure 3.
ω-3-PUFAs up-regulate the expression of insulin-sensitizing genes in adipose tissue and liver in ob/ob mice. Expression of PPARγ, IRS-1, and GLUT-4 in adipose tissue (A) and their counterparts in the liver (i.e., PPARγ, IRS-2, and GLUT-2) (B) was determined by real-time RT-PCR in samples from ob/ob mice receiving either a control diet (n=8) or a diet enriched with ω-3-PUFAs (n=16). Results are expressed as means ± se; P values vs. CT group.
Figure 4.
Figure 4.
Effects of the ω-3-PUFA DHA on insulin tolerance and AMPK phosphorylation in ob/ob mice. A) Insulin tolerance test curves were performed in wild-type mice (n=4) and in ob/ob mice (n=5) receiving saline and in ob/ob mice receiving DHA at a dose of 4 μg/g body weight (n=5) every 12 h for 4 d. Mice received an intraperitoneal injection of recombinant insulin (0.0075 U/g body weight), and blood samples were collected from the tail 0, 15, 30, 45, and 60 min later for serum glucose determination. Inset: analysis of area under the curve (AUC) for these experiments. Results are expressed as means ± se. aP < 0.05 vs. WT; *P < 0.05 vs. ob/ob group treated with saline. B) AMPK phosphorylation was determined in samples of liver, adipose, and muscle tissues obtained from control ob/ob mice (CT; n=8) and ob/ob mice receiving the ω-3-PUFA DHA (n=8). Equal quantities of total protein (50 μg liver, 80 μg adipose tissue, and 100 μg muscle tissue) were separated by SDS-PAGE and analyzed by Western blot. Top and bottom blots represent protein bands detected by specific anti-AMPK phosphorylated on the residue Thr172 or by specific anti-total AMPK antibodies, respectively. Densitometric analysis of the phosphorylated AMPK-to-total AMPK ratio from these blots is shown at bottom. Results are expressed as means ± se. *P < 0.05 vs. CT group.
Figure 5.
Figure 5.
Lipidomic analysis of adipose tissue samples using LC/MS/MS. A) Levels of lipid mediators generated in adipose tissue of untreated ob/ob mice. Samples were extracted in C18-ODS solid-phase columns and analyzed by LC-MS/MS-based lipidomics (see Materials and Methods for details). B) Percentage change of tissue levels of ω-3-PUFA-derived docosanoids and ω-6-PUFA-derived eicosanoids in mice receiving ω-3-PUFA-enriched diet (n=8) compared to those receiving CT diet (n=4). Results are expressed as means ± se. *P < 0.05, **P < 0.005, ***P < 0.0005 vs. CT group.
Figure 6.
Figure 6.
Effects of resolvins and protectins on liver and adipose tissue from ob/ob mice. A) Representative photomicrographs of liver sections stained with Oil Red O (top) or incubated with an F4/80 specific antibody (bottom) in ob/ob mice receiving intraperitoneal saline as a control (n=5) or resolvin E1 (RvE1) (n=5) for 4 d. B) Adiponectin, GLUT-4, IRS-1, and PPARγ mRNA expression in adipose tissue samples obtained from ob/ob mice treated with RvE1 mice was determined by real-time RT-PCR. C) Adipose tissue explants from ob/ob mice were incubated for 12 h in the presence of vehicle (V; 0.5% EtOH), protectin D1 (PD1; 100 and 250 nM), or rosiglitazone (10 μM). Four different experiments with duplicates were performed. At the end of the incubation period, RNA was extracted, and adiponectin expression was determined by real-time RT-PCR. Results are expressed as means ± se; P values vs. CT group (A, B) or V group (C).

References

    1. Clark J M, Brancati F L, Diehl A M. Nonalcoholic fatty liver disease. Gastroenterology. 2002;122:1649–1657. - PubMed
    1. Falck-Ytter Y, Younossi Z M, Marchesini G, McCullough A J. Clinical features and natural history of nonalcoholic steatosis syndromes. Semin Liver Dis. 2001;21:17–26. - PubMed
    1. Angulo P. Nonalcoholic fatty liver disease. N Engl J Med. 2002;346:1221–1231. - PubMed
    1. Sanyal A J. AGA technical review on nonalcoholic fatty liver disease. Gastroenterology. 2002;123:1705–1725. - PubMed
    1. Ginsberg H N. Is the slippery slope from steatosis to steatohepatitis paved with triglyceride or cholesterol? Cell Metab. 2006;4:179–181. - PubMed

Publication types

MeSH terms