

Population genomics of domestic and wild yeasts
- PMID: 19212322
- PMCID: PMC2659681
- DOI: 10.1038/nature07743
Population genomics of domestic and wild yeasts
Abstract
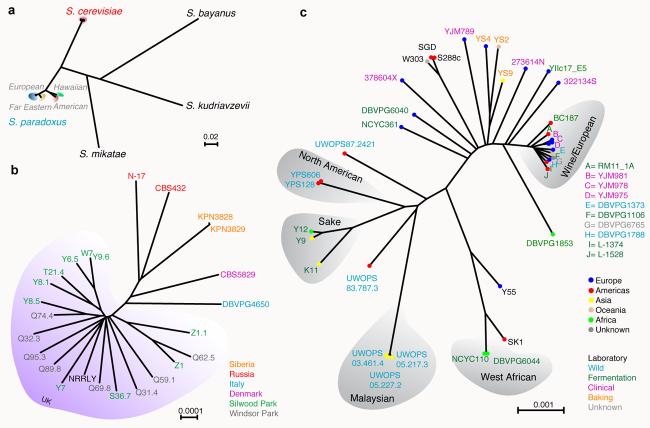
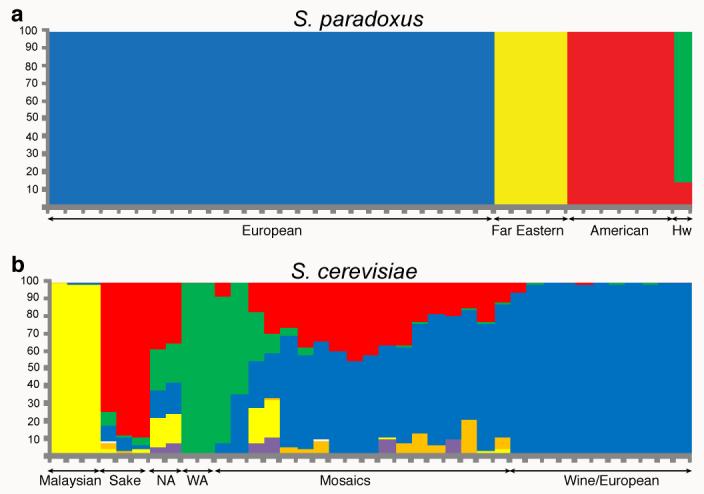
Since the completion of the genome sequence of Saccharomyces cerevisiae in 1996 (refs 1, 2), there has been a large increase in complete genome sequences, accompanied by great advances in our understanding of genome evolution. Although little is known about the natural and life histories of yeasts in the wild, there are an increasing number of studies looking at ecological and geographic distributions, population structure and sexual versus asexual reproduction. Less well understood at the whole genome level are the evolutionary processes acting within populations and species that lead to adaptation to different environments, phenotypic differences and reproductive isolation. Here we present one- to fourfold or more coverage of the genome sequences of over seventy isolates of the baker's yeast S. cerevisiae and its closest relative, Saccharomyces paradoxus. We examine variation in gene content, single nucleotide polymorphisms, nucleotide insertions and deletions, copy numbers and transposable elements. We find that phenotypic variation broadly correlates with global genome-wide phylogenetic relationships. S. paradoxus populations are well delineated along geographic boundaries, whereas the variation among worldwide S. cerevisiae isolates shows less differentiation and is comparable to a single S. paradoxus population. Rather than one or two domestication events leading to the extant baker's yeasts, the population structure of S. cerevisiae consists of a few well-defined, geographically isolated lineages and many different mosaics of these lineages, supporting the idea that human influence provided the opportunity for cross-breeding and production of new combinations of pre-existing variations.
Figures
References
-
- Goffeau A, et al. Life with 6000 genes. Science. 1996;274:546, 563–7. - PubMed
-
- Mewes HW, et al. Overview of the yeast genome. Nature. 1997;387:7–65. - PubMed
-
- Sniegowski PD, Dombrowski PG, Fingerman E. Saccharomyces cerevisiae and Saccharomyces paradoxus coexist in a natural woodland site in North America and display different levels of reproductive isolation from European conspecifics. FEMS Yeast Res. 2002;1:299–306. - PubMed
-
- Aa E, Townsend JP, Adams RI, Nielsen KM, Taylor JW. Population structure and gene evolution in Saccharomyces cerevisiae. FEMS Yeast Res. 2006;6:702–15. - PubMed
Publication types
MeSH terms
Grants and funding
- 067008/WT_/Wellcome Trust/United Kingdom
- BBS/E/F/00042258/BB_/Biotechnology and Biological Sciences Research Council/United Kingdom
- G10415/BB_/Biotechnology and Biological Sciences Research Council/United Kingdom
- BB/F015216/1/BB_/Biotechnology and Biological Sciences Research Council/United Kingdom
- 084507/WT_/Wellcome Trust/United Kingdom
LinkOut - more resources
Full Text Sources
Other Literature Sources
Molecular Biology Databases
