. 2009 Jan;56(1):63-76.
doi: 10.1109/TUFFC.2009.1006.

Image quality, tissue heating, and frame rate trade-offs in acoustic radiation force impulse imaging

Affiliations

Image quality, tissue heating, and frame rate trade-offs in acoustic radiation force impulse imaging

Richard R Bouchard et al. IEEE Trans Ultrason Ferroelectr Freq Control. 2009 Jan.

Abstract

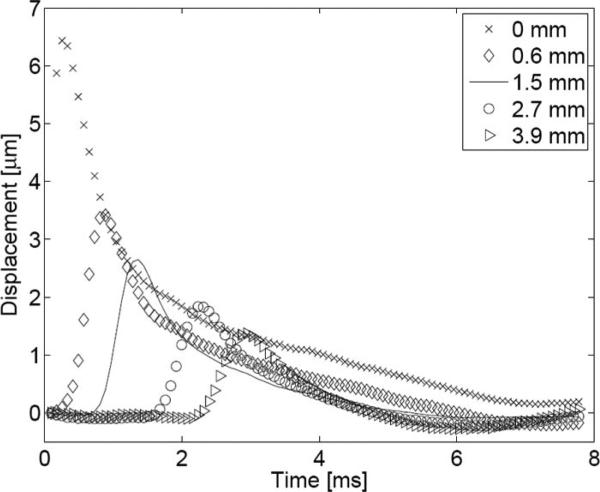
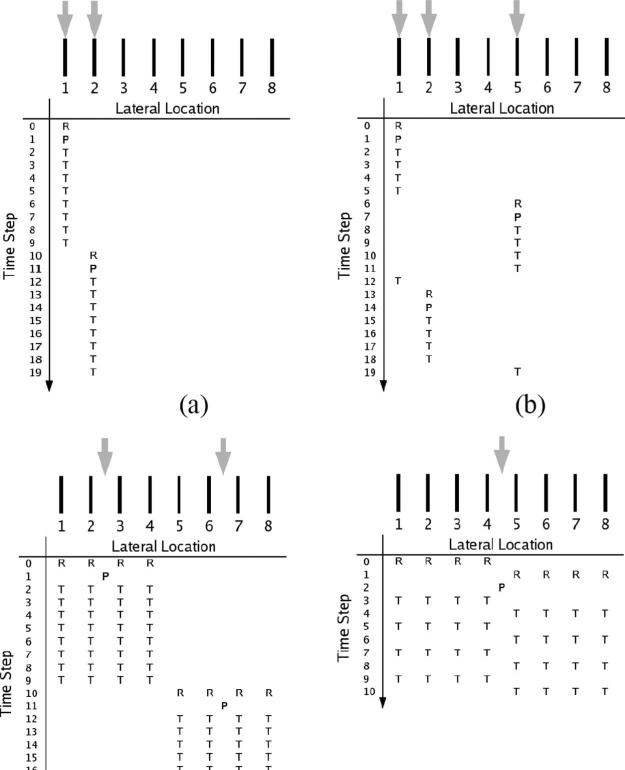
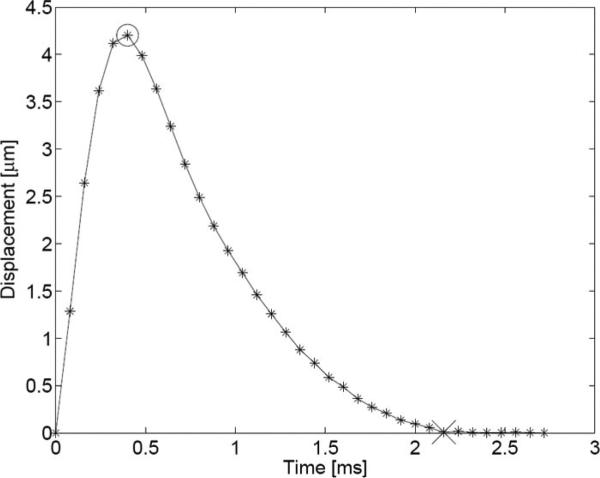
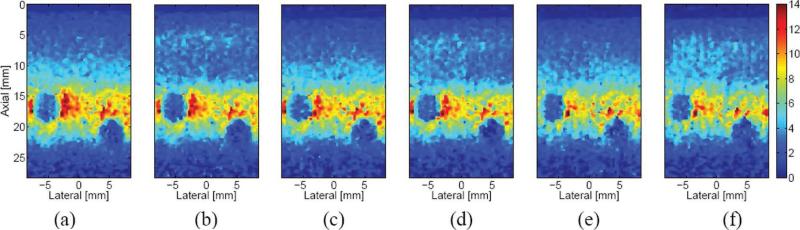
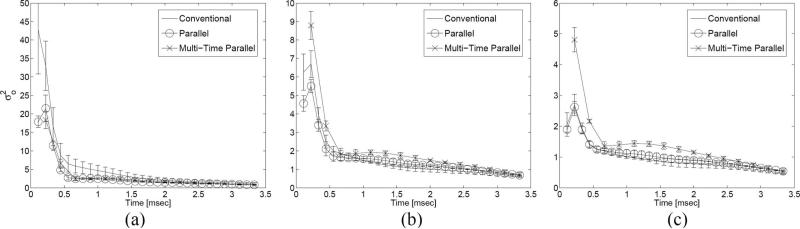
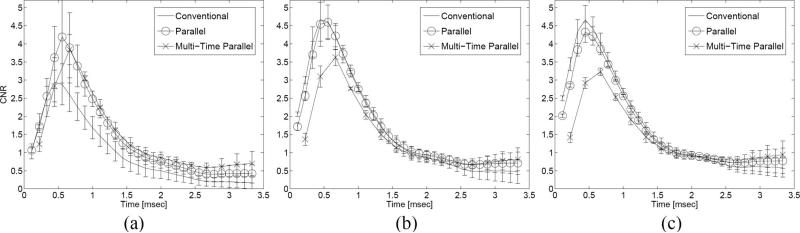
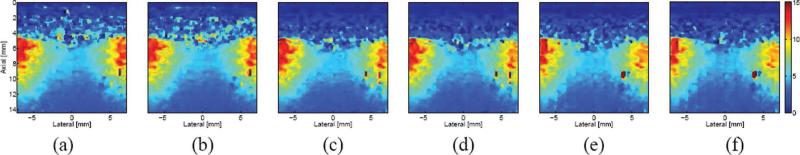
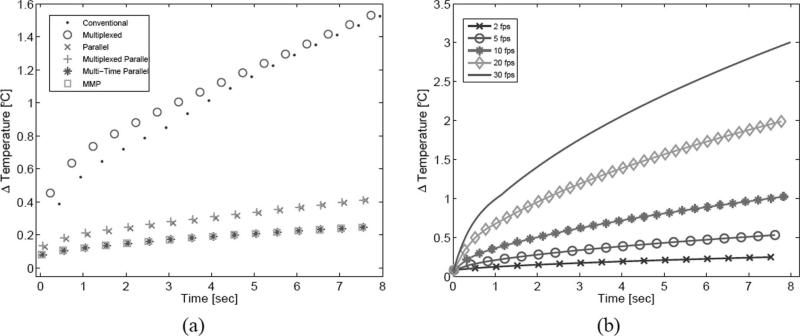
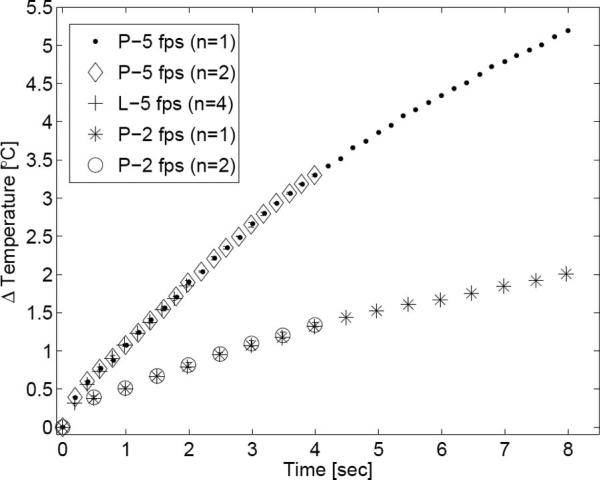
The real-time application of acoustic radiation force impulse (ARFI) imaging requires both short acquisition times for a single ARFI image and repeated acquisition of these frames. Due to the high energy of pulses required to generate appreciable radiation force, however, repeated acquisitions could result in substantial transducer face and tissue heating. We describe and evaluate several novel beam sequencing schemes which, along with parallel-receive acquisition, are designed to reduce acquisition time and heating. These techniques reduce the total number of radiation force impulses needed to generate an image and minimize the time between successive impulses. We present qualitative and quantitative analyses of the trade-offs in image quality resulting from the acquisition schemes. Results indicate that these techniques yield a significant improvement in frame rate with only moderate decreases in image quality. Tissue and transducer face heating resulting from these schemes is assessed through finite element method modeling and thermocouple measurements. Results indicate that heating issues can be mitigated by employing ARFI acquisition sequences that utilize the highest track-to-excitation ratio possible.


Figures

Fig. 1
Fig. 1
On-axis and off-axis response to an ARFI excitation in a homogeneous phantom. The axial displacement is plotted as a function of time following the initiation of an ARFI excitation for 5 locations: 0.0 (on-axis), 0.6, 1.5, 2.7, and 3.9 mm laterally offset from the axis of excitation.
Fig. 2
Fig. 2
Diagrams for the following ARFI imaging beam sequences: (a) conventional, (b) multiplexed, (c) parallel-receive, and (d) multi-time. Black bars denote the lateral locations of tracking beams; gray arrows, the relative ARFI excitation locations. Within each diagram, the horizontal axis denotes relative tracking/push locations, whereas the vertical axis represents time. Reference, push, and track pulses are represented with the characters R, P, and T, respectively.
Fig. 3
Fig. 3
Plot of the typical response of soft tissue to an ARFI excitation in the absence of physiologic motion. Axial displacement is plotted for a region at the focus of the excitation. Asterisks indicate sampling points; the circle indicates the point of peak displacement; the “x” denotes the point in time at which the medium has recovered.
Fig. 4
Fig. 4
Cross section of ablation site in bovine cardiac tissue. The black arrows indicate the approximate distal and lateral boundaries of the ablated region; centimeters are numbered in the presented scale.
Fig. 5
Fig. 5
Matched ARFI images of a CIRS phantom generated 0.44 ms after the initiation of an ARFI excitation and acquired with 6 different acquisition schemes: (a) conventional, (b) multiplexed, (c) parallel, (d) multiplexed parallel, (e) multi-time parallel, and (f) MMP. The color bar at the far right of the figure depicts the range of axial displacement, from 0 to 14 microns; all 6 images are presented with the same dynamic range.
Fig. 6
Fig. 6
Plots depicting the displacement variance outside the lesion (σo2) as a function of the time following the initiation of an ARFI excitation for 3 different push F/#s: (a) 1.0, (b) 1.5, and (c) 2.0. Each figure contains the displacement variance plot for 3 different acquisition schemes (indicated by the legend); each plot displays the average of 3 independent trials with error bars indicating one standard deviation.
Fig. 7
Fig. 7
Plots depicting the CNR in a lesion phantom as a function of the time following the initiation of an ARFI excitation for 3 different push F/#s: (a) 1.0, (b) 1.5, and (c) 2.0.
Fig. 8
Fig. 8
Matched ARFI images of an ablated region in excised tissue from the left ventricle of a bovine heart. Images were generated 0.44 ms after the initiation of an ARFI excitation with the following acquisition schemes: (a) conventional, (b) multiplexed, (c) parallel, (d) multiplexed parallel, (e) multi-time parallel, and (f) MMP. The color bar at the far right of the figure depicts the range of axial displacement, from 0 to 15 microns; all 6 images are presented with the same dynamic range.
Fig. 9
Fig. 9
Simulated peak tissue heating plots. The plot on the left (a) depicts the simulated peak tissue heating resulting from all 6 acquisition schemes, each transmitted at 2 fps for 8 s. The plot on the right (b) depicts the simulated peak tissue heating resulting from the MMP acquisition scheme for 5 different frame rates through an 8 s acquisition period.
Fig. 10
Fig. 10
Transducer surface heating plot. The maximum transducer face temperature increase following each frame acquisition is plotted for the MMP acquisition scheme. The key indicates the test medium (P = phantom; L = bovine liver), frame rate, and number of samples averaged for that trial. When possible, error bars indicating one standard deviation are also shown.

Similar articles

Cited by

References

    1. Bercoff J, Chaffai S, Tanter M, Fink M. Ultrafast imaging of beamformed shear waves induced by the acoustic radiation force in soft tissues: Application to transient elastography. Proc. IEEE Ultrason. Symp. 2002:1899–1902.
    1. Fatemi M, Greenleaf JF. Vibro-acoustography: An imaging modality based on ultrasound stimulated acoustic emission. Proc. Natl. Acad. Sci. USA. 1999;96(12):6603–6608. - PMC - PubMed
    1. Konofagou EE, Ottensmeyer M, Agabian S, Dawson S, Hynynen K. Estimating localized oscillatory tissue motion for assessment of the underlying mechanical modulus. Ultrasonics. 2004;42:951–956. - PubMed
    1. Melodelima D, Bamber J, Duck F, Shipley J, Xu L. Elastography for breast cancer diagnosis using radiation force: System development and performance evaluation. Ultrasound Med. Biol. 2006;32:387–396. - PubMed
    1. Nightingale KR, Bentley R, Trahey GE. Observations of tissue response to acoustic radiation force: Opportunities for imaging. Ultrason. Imag. 2002;24:100–108. - PubMed

Publication types