. 2009;60(3):939-54.
doi: 10.1093/jxb/ern348. Epub 2009 Feb 12.

Salt stress-induced cell death in the unicellular green alga Micrasterias denticulata

Affiliations

Salt stress-induced cell death in the unicellular green alga Micrasterias denticulata

Matthias Josef Affenzeller et al. J Exp Bot. 2009.

Abstract

Programmed cell death (PCD) is a key element in normal plant growth and development which may also be induced by various abiotic and biotic stress factors including salt stress. In the present study, morphological, biochemical, and physiological responses of the theoretically immortal unicellular freshwater green alga Micrasterias denticulata were examined after salt (200 mM NaCl or 200 mM KCl) and osmotic stress induced by iso-osmotic sorbitol. KCl caused morphological changes such as cytoplasmic vacuolization, extreme deformation of mitochondria, and ultrastructural changes of Golgi and ER. However, prolonged salt stress (24 h) led to the degradation of organelles by autophagy, a special form of PCD, both in NaCl- and KCl-treated cells. This was indicated by the enclosure of organelles by ER-derived double membranes. DNA of NaCl- and KCl-stressed cells but not of sorbitol-treated cells showed a ladder-like pattern on agarose gel, which means that the ionic rather than the osmotic component of salt stress leads to the activation of the responsible endonuclease. DNA laddering during salt stress could be abrogated by addition of Zn(2+). Neither cytochrome c release from mitochondria nor increase in caspase-3-like activity occurred after salt stress. Reactive oxygen species could be detected within 5 min after the onset of salt and osmotic stress. Respiration, photosynthetic activity, and pigment composition indicated an active metabolism which supports programmed rather than necrotic cell death in Micrasterias after salt stress.


Figures

Fig. 1.
Fig. 1.
Percentage of FDA positive Micrasterias cells after treatment with 200 mM NaCl, 200 mM KCl or 339 mM sorbitol for 1, 3, 6, 12, 24, and 48 h. Control represents untreated cells. Data are the means of three independent experiments +SE.
Fig. 2.
Fig. 2.
Light microscopic images of Micrasterias. Untreated control (A), 3 h treatment (B–D) and 24 h treatment (E–G) with 200 mM KCl (B, E), 200 mM NaCl (C, F), and 339 mM sorbitol (D, G). Scale bar=50 μm.
Fig. 3.
Fig. 3.
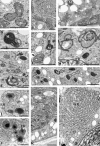
TEM micrographs showing ultrastructure of control cell (A, B), of cells after treatment with 339 mM sorbitol for 3 h (C) and ultrastructural changes after treatment with 200 mM KCl for 3 h (D–L). (D–F, H) Mitochondria with electron dense matrix and balloon-shaped membrane protrusions, (E, G) involute and inactive dictyosomes with decreased cisternal number, (F) multivesicular body (arrow), (I, J) swollen ER cisternae beginning to surround microbodies, (K) chloroplast with slightly dilated thylakoids and dense matrix, (L) ER compartments involute. Cl, chloroplast; D, dicytosome; M, mitochondrion. Bar=1 μm.
Fig. 4.
Fig. 4.
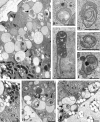
TEM micrographs showing ultrastructural changes after 24 h treatment with 200 mM KCl (A), with 300 mM KCl (B–F), and 20 h treatment with 200 mM KCl (G–I). (A, H, I) Involute and inactive dictyosomes with decreased number of cisternae surrounded by swollen ER compartments (arrows) indicating autophagy. (A, C, G–I) Mitochondria with electron dense matrix, (G, I) chloroplast reveals dense stroma and slightly dilated thylakoids, (B, F) autophagosomes as indicated by surrounding of organelles with ER cisternae, (C) mitochondrion with balloon-shaped membrane protrusion, (D, E) involute and inactive dictyosomes. Cl, chloroplast; D, dicytosomes; M, mitochondrion. Bar=1 μm.
Fig. 5.
Fig. 5.
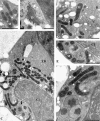
TEM micrographs showing ultrastructural changes after 3 h treatment with 200 mM NaCl (A, B) and 24 h treatment with 200 mM NaCl (C–F). (A) Mitochondria with electron dense matrix, (B) dictyosome without any specific ultrastructural changes, (C) numerous mitochondria with electron dense matrix, dictyosomes are disintegrated into numerous small vesicles, autophagosome (arrow) including three microbodies, dilated ER compartments, unchanged chloroplast structure but electron dense stroma, (D) dictyosomes disintegrating into numerous small vesicles, mitochondria with electron dense matrix, (E, F) autophagosomes (arrows), mitochondria with electron dense matrix, (F) enlarged detail of (C). Cl, chloroplast; D dictyosome; M, mitochondrion; V, vesicles. Bar=1 μm.
Fig. 6.
Fig. 6.
Photosynthetic efficiency (Fv/Fm) of Micrasterias cells treated with 200 mM KCl, 200 mM NaCl or 339 mM sorbitol for 0.5, 1, 3, 6, 12, and 24 h. Control represent untreated Micrasterias cells. Data are means of three experiments +SE.
Fig. 7.
Fig. 7.
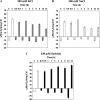
Changes in photosynthetic O2 production and in O2 consumption (dark respiration) by different solutes with time. (A) 200 mM KCl, (B) 200 mM NaCl, (C) 339 mM sorbitol. C, control. Error bar indicates ±SE.
Fig. 8.
Fig. 8.
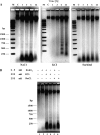
(A) Time-dependent DNA laddering in Micrasterias after treatment with 200 mM NaCl, 200 mM KCl or 339 mM sorbitol. C DNA of untreated control cells. M, DNA marker. (B) Inhibition of DNA laddering by Zn2+ in Micrasterias. Lanes 1–6: DNA of cells after different treatments. Lane 1, controls; lane 2, 0.5 mM ZnSO4 for 7 h; lanes 3 and 5, pre-treatment with 0.5 mM ZnSO4 for 1 h before the additon of 200 mM KCl or 200 mM NaCl for 6 h, respectively; lanes 4 and 6, 200 mM KCl or 200 mM NaCl alone for 6 h, respectively. 2 μg DNA were loaded in each lane of a 1.5% agarose gel. Images are shown in inverted mode.
Fig. 9.
Fig. 9.
Effect of salt and osmotic stress (200 mM KCl, 200 mM NaCl or 339 mM sorbitol) on the activity of caspase-3-like enzyme after 30 min and 3 h. Bars represent means of fold change enzyme activity +SE compared to control (set to 1 as indicated by the horizontal dashed line).
Fig. 10.
Fig. 10.
Intracellular reactive oxygen species (ROS) production in control Micrasterias cells and after 5 min, 30 minutes and 3 h treatment with 339 mM sorbitol, 200 mM NaCl or 200 mM KCl. Data are means of four independent experiments +SE.

Comment in

References

    1. Aichinger N, Lütz-Meindl U. Organelle interactions and possible degradation pathways visualized in high-pressure frozen algal cells. Journal of Microscopy. 2005;219:86–94. - PubMed
    1. Arisz SA, Valianpour F, van Gennip AH, Munnik T. Substrate preference of stress-activated phospholipase D in Chlamydomonas and its contribution to PA formation. The Plant Journal. 2003;34:595–604. - PubMed
    1. Bassham DC, Laporte M, Marty F, Moriyasu Y, Ohsumi Y, Olsen LJ, Yoshimoto K. Autophagy in development and stress responses of plants. Autophagy. 2006;2:2–11. - PubMed
    1. Bérubé KA, Dodge JD, Ford TW. Effects of chronic salt stress on the ultrastructure of Dunaliella bioculata (Chlorophyta, Volvocales): mechanisms of response and recovery. European Journal of Phycology. 1999;34:117–123.
    1. Bonneau L, Ge Y, Drury GE, Gallois P. What happened to plant caspases? Journal of Experimental Botany. 2008;59:491–499. - PubMed

Publication types

MeSH terms