. 2009;60(4):1349-62.
doi: 10.1093/jxb/erp009. Epub 2009 Feb 12.

Sl-IAA3, a tomato Aux/IAA at the crossroads of auxin and ethylene signalling involved in differential growth

Affiliations

Sl-IAA3, a tomato Aux/IAA at the crossroads of auxin and ethylene signalling involved in differential growth

Salma Chaabouni et al. J Exp Bot. 2009.

Abstract

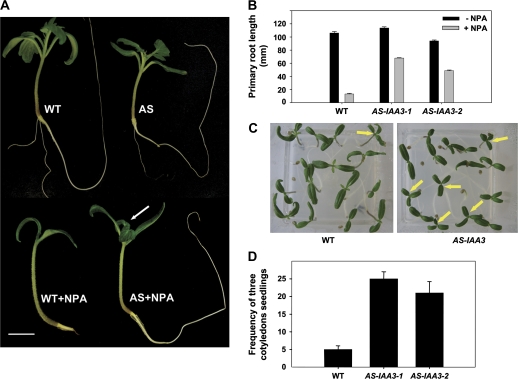
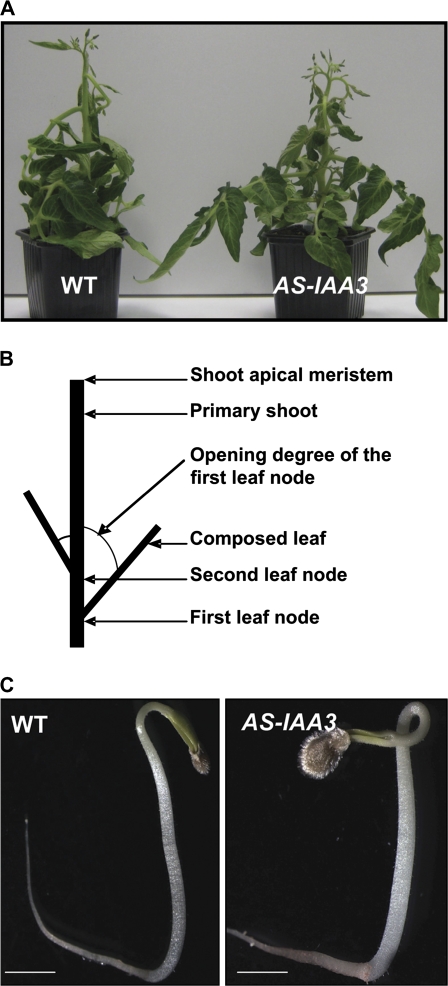
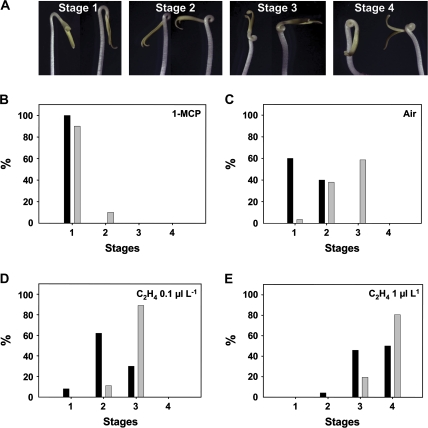
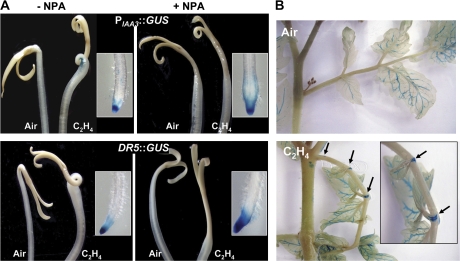
Whereas the interplay of multiple hormones is essential for most plant developmental processes, the key integrating molecular players remain largely undiscovered or uncharacterized. It is shown here that a member of the tomato auxin/indole-3-acetic acid (Aux/IAA) gene family, Sl-IAA3, intersects the auxin and ethylene signal transduction pathways. Aux/IAA genes encode short-lived transcriptional regulators central to the control of auxin responses. Their functions have been defined primarily by dominant, gain-of-function mutant alleles in Arabidopsis. The Sl-IAA3 gene encodes a nuclear-targeted protein that can repress transcription from auxin-responsive promoters. Sl-IAA3 expression is auxin and ethylene dependent, is regulated on a tight tissue-specific basis, and is associated with tissues undergoing differential growth such as in epinastic petioles and apical hook. Antisense down-regulation of Sl-IAA3 results in auxin and ethylene-related phenotypes, including altered apical dominance, lower auxin sensitivity, exaggerated apical hook curvature in the dark and reduced petiole epinasty in the light. The results provide novel insights into the roles of Aux/IAAs and position the Sl-IAA3 protein at the crossroads of auxin and ethylene signalling in tomato.


Figures

Fig. 1.
Fig. 1.
Genomic structure of the tomato Sl-IAA3 gene. The black portion represents the promoter region, the grey lines the introns, the grey boxes the exons, and the white boxes the untranslated regions (UTR). The putative auxin and ethylene cis-acting elements are indicated by black bars. The black arrow represents the antisense construct used to generate the silenced lines.
Fig. 2.
Fig. 2.
Tissue-specific and ethylene-dependent expression of Sl-IAA3. The expression analyses were carried out by qRT-PCR using RNA samples extracted from various tomato tissues. (A) Analysis of Sl-IAA3 transcript levels in different organs. SI-IAA3 mRNA accumulation was monitored in stem (S), leaf (L), flower (F), root (R), and red fruit (Re). (B) Expression pattern of SI-IAA3 during the late stages of fruit development: immature green fruit, IMG; mature green, MG; breaker, Br; turning, Tu; orange, Or; red, Re; red-ripe, RR. (C) Expression pattern of Sl-IAA3 in wild type (WT) and rin, nor, and Nr ripening mutants. RNA samples were extracted from fruit collected 43 d and 70 d after anthesis, corresponding in the WT to MG and Re stages, respectively. (D) Ethylene responsiveness of the Sl-IAA3 gene. RNA samples were extracted from MG fruit treated for 5 h with air or with 50 μl l−1 ethylene. (E) Br fruit treated with 1 μl l−1 of 1-MCP for 16 h. Relative expression level on the y-axis refers to the fold difference in Sl-IAA3 expression relative to stem in (A), MG stage in (B, C), and untreated control fruit in (D, E). The expression data are means of three replicates ±standard error.
Fig. 3.
Fig. 3.
Auxin responsiveness of the Sl-IAA3 gene. (A) qRT-PCR analysis of Sl-IAA3 transcript levels in 3-week-old light-grown control and auxin-treated (20 μM IAA for 2 h) seedlings in presence or absence of 1 μl l−11-MCP applied 16 h prior to auxin treatment. Relative expression level on the y-axis refers to the fold difference in SI-IAA3 transcript levels relative to the non-treated plantlets. (B) Auxin responsiveness of the Sl-IAA3 promoter. Tobacco protoplasts were transformed by PIAA3::GFP and incubated in the presence or absence of 2,4-D (50 μM). Transformation was performed in triplicate and, in each experiment, GFP fluorescence was measured by flow cytometry 16 h after transfection. Values are expressed in arbitrary units (a.u.) ±standard error. (C–F) Tissue-specific expression of Sl-IAA3 assessed in transgenic tomato expressing GUS reporter gene driven by the Sl-IAA3 promoter (PIAA3::GUS). The expression pattern was analysed in 3-week-old seedlings (C), leaves (D), roots (E), and MG fruit (F). (G–J) These images correspond to the same tissues treated for 2 h with 20 μM IAA. (K–N) These images correspond to the same tissues expressing the DR5 auxin-responsive promoter fused to the GUS reporter gene (DR5::GUS) and those in (O–R) to DR5::GUS treated with 20 μM IAA. The data are representative of at least three independent experiments with n > 20 seedlings examined per experiment.
Fig. 4.
Fig. 4.
Altered vegetative growth phenotypes in antisense Sl-IAA3 plants. (A) Down-regulation of Sl-IAA3 in transgenic tomato plants. The level of Sl-IAA3 transcripts in antisense lines (1 and 2) was assessed by qRT-PCR. Relative expression level refers to the fold difference in Sl-IAA3 transcript levels relative to the wild type (WT). (B) Reduced apical dominance in 7-week-old AS-IAA3 plants compared with WT. (C) The number of lateral shoots branching from the first leaf node in WT and AS-IAA3 plants. The data are the mean ±standard error of 30 plants and are representative of three independent experiments. (D) Auxin dose-response in hypocotyl segments. Hypocotyl fragments (8 mm long) from 3-week-old light-grown seedlings were incubated for 2 h in the presence of the indicated concentration of NAA. Elongation is given as percentage increase in final length over the initial length. The results are representative of data obtained with two independent AS-IAA3 lines and with two replicates for each line. Standard errors are indicated (n ≥25). (This figure is available in colour at JXB online.)
Fig. 5.
Fig. 5.
Auxin-associated phenotypes of Sl-IAA3 down-regulated lines. (A) Effect of NPA treatment on the development of light-grown wild-type (WT) and AS-IAA3 seedlings. WT and AS-IAA3 tomato seedlings (19-d-old) were grown in the presence or absence of 1 μM NPA. Leaf emergence is inhibited in WT but not in AS-IAA3 lines (white arrow). The scale bar indicates 10 mm. (B) Primary root length upon NPA treatment of light-grown WT and AS-IAA3 lines. Error bars represent mean ±standard error (n ≥60). (C) Triple cotyledon phenotype occurring at higher frequency in AS-IAA3 lines compared with WT. Three cotyledon structures are indicated by arrows in 7-d-old light-grown plantlets. (D) Frequency of triplicate cotyledons occurring in AS-IAA3 and WT seedlings expressed as a percentage of the total population. Error bars represent mean ±standard error of 40 plants. (This figure is available in colour at JXB online.)
Fig. 6.
Fig. 6.
Ethylene-associated phenotypes of AS-IAA3 lines. (A) Petiole epinasty in wild-type (WT) and AS-IAA3 plants in response to ethylene. Five-week-old light-grown plants were treated by 50 μl l−1 ethylene for 16 h. (B) Diagram depicting the position of the first and second leaf node in tomato plants. (C) Hook curvature in 5-d-old WT (left panel) and AS-IAA3 (right panel) etiolated seedlings. The scale bar indicates 5 mm. (This figure is available in colour at JXB online.)
Fig. 7.
Fig. 7.
Hook formation in AS-IAA3 lines upon ethylene treatment. (A) Assessment of different grades of hook formation in etiolated tomato seedlings treated with different concentrations of ethylene (0–1 μl l−1). Four stages have been defined corresponding to minimal exaggerated hook with a curvature angle lower than 180° (stage 1) to a maximal exaggerated hook with a curvature angle higher than 360° (stage 4). (B–E) Proportion of wild-type (black columns) and AS-IAA3 (grey columns) plants corresponding to the four stages of hook formation upon treatment with 1 μl l−1 1-MCP for 16 h (B), air (C), or 0.1 (D) and 1 μl l−1 exogenous ethylene (E).
Fig. 8.
Fig. 8.
Expression of PIAA3::GUS is associated with differential growth during hook formation and leaf epinastic response. (A) Tissue-specific expression of PIAA3::GUS and DR5::GUS in etiolated seedlings. PIAA3::GUS and DR5::GUS seedlings were dark-grown for 5 d and then treated for 48 h with air or 10 μl l−1 of ethylene in absence (left panel) or presence of NPA (right panel). The upper-panel shows the ethylene-dependent GUS staining in the apical hook of PIAA3::GUS tomato plants. The lower-panel shows GUS staining in the DR5::GUS-transformed plants used for detection of active auxin signalling in the hook. Inserts correspond to the expression of PIAA3::GUS and DR5::GUS in the root caps following ethylene treatment. (B) Expression of PIAA3::GUS in epinastic petioles. Six-week-old light-grown plants were placed in airtight chambers for 16 h in the absence (upper-panel) or presence (lower-panel) of 50 μl l−1 of ethylene. The arrows indicate the expression of GUS in the leaf nodes of the petiole. The images are representative of at least three independent experiments with n > 30 seedlings per experiment.
Fig. 9.
Fig. 9.
Impact of Sl-IAA3 down-regulation on the expression of auxin and ethylene response genes. The expression of members of the ARF (A), Aux/IAA (B), and ERF (C) gene families of transcription factors as well as the Sl-HLS gene (D) was assessed by qRT-PCR in 5-d-old dark-grown wild-type (WT) and AS-IAA3 etiolated seedlings. Primers used are listed in Table S2 in Supplementary data available at JXB online. Relative expression level on the y-axis refers to the fold difference in expression of each gene relative to that in WT seedlings taken as reference tissues. The data correspond to mean values of three replicates ±standard error.

Comment in

References

    1. Abel S, Nguyen MD, Chow W, Theologis A. ACS4, a primary indole acetic acid-responsive gene encoding 1-aminocyclopropane-1-carboxylate synthase in Arabidopsis thaliana: structural, characterization, expression in Escherichia coli, and expression characteristics in response to auxin. Journal of Biological Chemistry. 1995;270:19093–19099. - PubMed
    1. Altschul SF, Madden TL, Schaffer AA, Zhang J, Zhang Z, Miller W, Lipman DJ. Gapped BLAST and PSI-BLAST, a new generation of protein database search programs. Nucleic Acids Research. 1997;25:3389–3402. - PMC - PubMed
    1. Bleecker AB, Estelle MA, Somerville C, Kende H. Insensitivity to ethylene conferred by a dominant mutation in Arabidopsis thaliana. Science. 1988;26:1086–1089. - PubMed
    1. Chae HS, Cho YG, Park MY, Lee MC, Eun MY, Kang BG, Kim WT. Hormonal cross-talk between auxin and ethylene differentially regulates the expression of two members of the 1-aminocyclopropane-1-carboxylate oxidase gene family in rice (Oryza sativa L) Plant and Cell Physiology. 2000;41:354–362. - PubMed
    1. Dharmasiri N, Dharmasiri S, Estelle M. The F-box protein TIR1 is an auxin receptor. Nature. 2005a;435:441–445. - PubMed

Publication types

MeSH terms