

Comment
. 2009 Feb 13;323(5916):877; author reply 877.
doi: 10.1126/science.1166478.
Comment on "Dynamic shifts of limited working memory resources in human vision"
Affiliations
- PMID: 19213899
- PMCID: PMC2730043
- DOI: 10.1126/science.1166478
Item in Clipboard
Comment
Comment on "Dynamic shifts of limited working memory resources in human vision"
Science.
.
Abstract
Bays and Husain (Reports, 8 August 2008, p. 851) reported that human working memory, the limited information currently in mind, reflects resources distributed across all items in an array. In an alternative interpretation, memory is limited to several well-represented items. We argue that this item-limit model fits the extant data better than the distributed-resources model and is more interpretable theoretically.
Figures
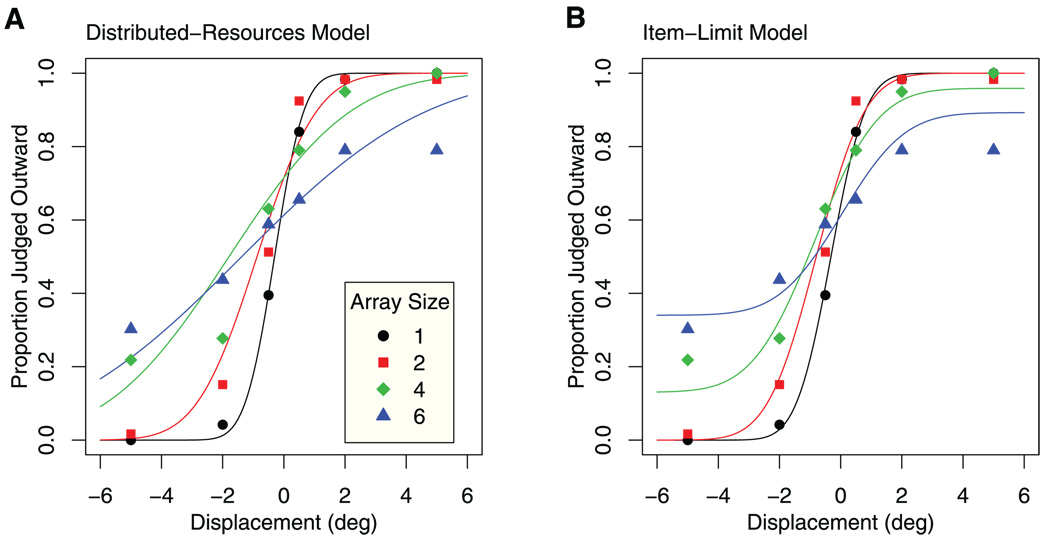
Two models of performance in an array-item displacement judgment task in which gaze remained at fixation (3). Data points in each panel are the proportions of trials in which the displacement was judged to be outward, as a function of the displacement in degrees of visual angle. The graph parameter indicated by point shapes is array size. To fit the models, the function SSE = ∑i,j[sin−1(p̂ij 0.5) − sin−1(pij 0.5)]2 was minimized, where the arcsin-square-root transform stabilizes variance across the range of proportions. Root mean square error was higher for the distributed-resources model (0.092) than for the item-limit model (0.078). (A) Lines represent the best-fitting distributed-resources model of Bays and Husain (3). Best-fitting parameters were σ0 = 0.75, r = 1.03, and µi = (0.30, 0.88, 1.79, and 1.38) degrees for the four array sizes, respectively. (B) Lines represent the best-fitting item-limit model. Best-fitting parameters were σ0=1.62, k=3.31, g=0.76, and µi = (0.32, 0.80, 0.84, and −0.04) degrees for the four array sizes, respectively. The model asymptotes at greater than zero on the low end and less than one on the high end.
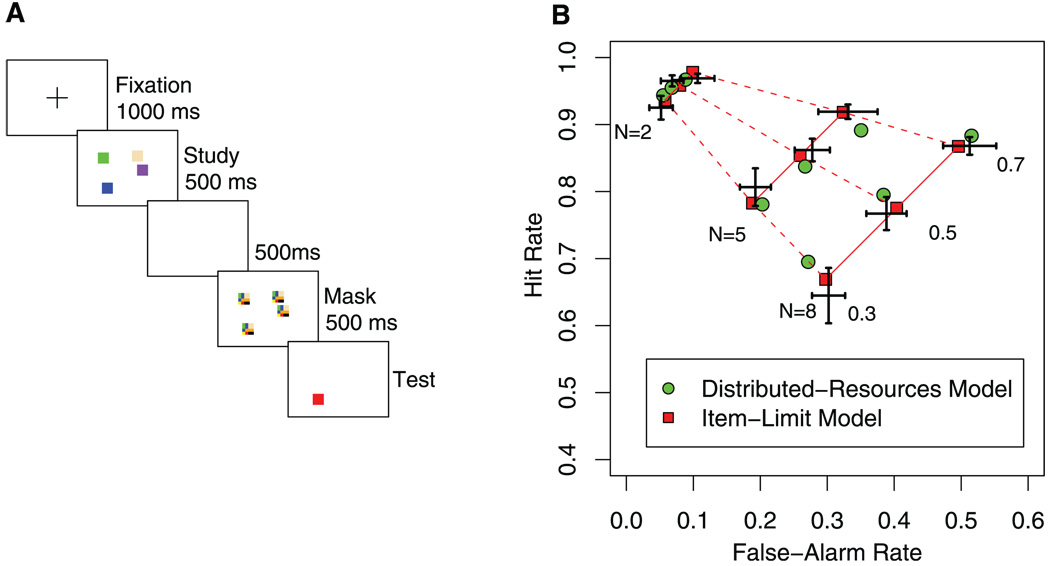
Procedure and data from Rouder et al. (2), with model fits from the item-limit and distributed-resources models. (A) On each trial, an array of differently colored squares was followed by a blank interval and then a post-perceptual mask. This mask was followed by a single-item probe, which the participants classified as the same as or different from the corresponding study square. The number of squares in the study array was 2, 5, or 8, and the base rate for a change (altered across trial blocks and known to participants) was 0.3, 0.5, or 0.7. Drawing is not to scale. (B) Receiver operating characteristics. Group results from (2) and averaged predictions for two models. Crosses reflect the data ± SEM on both axes. The averaged predictions of the item-limit model are denoted by the red squares. In this model, the predictions for each array size fall along a different solid line (with slope 1), and the predictions for each base rate fall along a different dashed line. The averaged predictions of the distributed-resources model results are denoted by the green circles. With five parameters per model, the results favored the item-limit model, −2 log-likelihood difference = 7.05.
Comment on
-
Dynamic shifts of limited working memory resources in human vision.Science. 2008 Aug 8;321(5890):851-4. doi: 10.1126/science.1158023. Science. 2008. PMID: 18687968 Free PMC article.
References
-
- Cowan N. Behav. Brain Sci. 2001;24:87. - PubMed
Publication types
MeSH terms
Grants and funding
LinkOut - more resources
Full Text Sources
