. 2009;4(3):291-308.
doi: 10.1038/nprot.2008.246. Epub 2009 Feb 12.

Imaging biological structures with fluorescence photoactivation localization microscopy

Affiliations

Imaging biological structures with fluorescence photoactivation localization microscopy

Travis J Gould et al. Nat Protoc. 2009.

Abstract

Fluorescence photoactivation localization microscopy (FPALM) images biological structures with subdiffraction-limited resolution. With repeated cycles of activation, readout and bleaching, large numbers of photoactivatable probes can be precisely localized to obtain a map (image) of labeled molecules with an effective resolution of tens of nanometers. FPALM has been applied to a variety of biological imaging applications, including membrane, cytoskeletal and cytosolic proteins in fixed and living cells. Molecular motions can be quantified. FPALM can also be applied to nonbiological samples, which can be labeled with photoactivatable probes. With emphasis on cellular imaging, we describe here the adaptation of a conventional widefield fluorescence microscope for FPALM and present step-by-step procedures to successfully obtain and analyze FPALM images. The fundamentals of this protocol may also be applicable to users of similar imaging techniques that apply localization of photoactivatable probes to achieve super-resolution. Once alignment of the setup has been completed, data acquisitions can be obtained in approximately 1-30 min and analyzed in approximately 0.5-4 h.


Figures
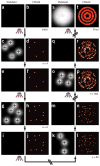
Figure 1
Figure 1
Concept of FPALM. (a) Initially, photoactivatable probes are inactive and nonfluorescent under illumination by the readout laser (assumed to be continuous throughout) and (b) no molecules have been localized. After a pulse of illumination by the activation laser (purple light), (c) a sparse subset of molecules are activated and become fluorescent (bright spots) under the readout laser (on continuously). These active (fluorescent) molecules can be localized (black crosses) to start the buildup of the FPALM image, which is comprised of the plotted positions of all localized molecules (e.g., n=4 in d and f). After the initial subset of (e) activated molecule bleaches, another subset of molecules is activated, (g) read out and (i) bleached to continue building the FPALM image (n=9 in h and j). After many cycles of (k,m,o,q) activation, readout and bleaching, the FPALM image begins to show structures (l,n; n=50) and shows the underlying configuration of molecules as the density of localized molecules increases (p,r; n=300). After a large number of photoactivatable molecules (n=10,000) have been activated, imaged and localized, (t) the FPALM image shows structures on subdiffraction length scales that are not resolvable in the (s) conventional widefield image. Images are simulated.
Figure 2
Figure 2
FPALM experimental setup. (a) The readout laser is directed into the microscope stand using mirrors M1, M2 and M4, whereas mirror M3 and dichroic mirror DM1 provide freedom of adjustment to align the activation laser to be collinear with the readout laser along the optical axis (OA, dashed line). Both lasers are focused by lens L1 located near the back port of the microscope and directed to the objective lens (OBJ) by dichroic mirror DM2 to illuminate sample S labeled with photoactive probes. Fluorescence from the sample is collected by OBJ, separated from laser light by DM2, band-pass filtered (F) and focused by the tube lens (TL) to form an image on the EMCCD camera sensor. Laser intensities at the sample are controlled using neutral-density filters ND1 and ND2. Shutters SH1 and SH2 allow on/off control of the readout and activation lasers, respectively. (b) Additional lenses (L2 and L3 with focal lengths f2 and f3, respectively) arranged as a telescope in the detection path may be added to increase the total magnification. The original focal plane (FP) of TL is now imaged onto the EMCCD camera with a lateral magnification equal to the ratios of the focal lengths, f3/f2 times the original magnification.
Figure 3
Figure 3
Identifying single molecules. Images of single molecules of Dendra2-actin from fixed fibroblast cells with different numbers of photons (~ 1,200 for ae, ~ 400 for fj and ~ 1,200 for ko) and pixel binning (1 × 1 for aj and 2 × 2 for ko). The color-coded images in be, gj and lo show the number of pixels above two thresholds (printed at the top of the column) for the molecules shown in a,f and k, respectively. Pixels below both thresholds are red, those above the pixel count threshold (PCT) (green value) but below the minimum intensity threshold (MIT) are shown in green and those above the MIT (yellow value) are shown in yellow. (pt) A time series of 50-ms frames cropped around a single dendra2-actin molecule showing stepwise activation (compare p with q) and stepwise photobleaching (compare r with s). The pixel color corresponding to the number of detected photons in that pixel is shown by the colorbar (left) for a,f,k and pt.
Figure 4
Figure 4
Example timing sequences for FPALM acquisitions. The readout and activation beam intensities (arbitrary scale) are plotted as a function of time (time axis not to scale), e.g., acquisitions using (a) continuous illumination with both beams and (b) alternating activation and readout illumination. (c) The acquisition settings are prepared. (d) The sample is illuminated with the readout beam (at reduced intensity to reduce photobleaching) to select an ROI for imaging. (e) The readout beam is shuttered to reduce further photobleaching, and the readout beam intensity is returned to acquisition level before the kinetic series begins. (f) The microscope shutter is opened to continuously illuminate the sample with the readout beam and acquisition is begun immediately. (g) Activation protocols are initiated once the density of visible molecules decreases to less than ~1 μm−2. The intensity of the activation beam may be increased over time as the pool of inactive molecules is depleted. (h) Both beams are shuttered and data acquisition ends. Approximate duration of steps: c, ~1 min; d, approximately 1–10 min; e, ~30 s; fh, approximately from 10 s to 20 min.
Figure 5
Figure 5
Typical FPALM image of Dendra2-actin expressed in a fixed mouse fibroblast. (a) The distribution of Dendra2-actin molecules (13,256 molecules) localized with ~24-nm median localization precision resolves actin fiber bundles at length scales well below the diffraction limit. Molecules are plotted as 2D Gaussian spots of width proportional to the calculated localization precision and intensity proportional to the number of detected photons. (b) Zoom-in of boxed region in (a) (1,424 molecules) shows enhancement in resolution over (c) conventional widefield fluorescence image. Scale bar, 2 μm for (a); 500 nm for (b) and (c). Brightness and contrast were adjusted linearly in (c) for display.
Figure 6
Figure 6
Illustration of troubleshooting of pixelization artifact in FPALM image of Dendra2-actin expressed in a fixed fibroblast. (a) Plots of molecular positions appear pixelated due to failed localizations resulting from too much background subtraction. (b) Pixelization no longer occurs after re-analysis using a 50% reduction in the zero level of the background subtraction. Scale bar, 1 μm for (a) and (b).

References

    1. Born M, Wolf E. Principles of Optics: Electromagnetic Theory of Propagation, Interference and Diffraction of Light. Cambridge University Press; New York: 1997.
    1. Hell SW. Far-field optical nanoscopy. Science. 2007;316:1153–1158. - PubMed
    1. Hell SW, Wichmann J. Breaking the diffraction resolution limit by stimulated emission: stimulated-emission-depletion fluorescence microscopy. Opt Lett. 1994;19:780–782. - PubMed
    1. Hess ST, Girirajan TP, Mason MD. Ultra-high resolution imaging by fluorescence photoactivation localization microscopy (FPALM) Biophys J. 2006;91:4258–4272. - PMC - PubMed
    1. Betzig E, et al. Imaging intracellular fluorescent proteins at nanometer resolution. Science. 2006;313:1642–1645. - PubMed

Publication types

MeSH terms

Substances