

Can monkeys choose optimally when faced with noisy stimuli and unequal rewards?
- PMID: 19214201
- PMCID: PMC2631644
- DOI: 10.1371/journal.pcbi.1000284
Can monkeys choose optimally when faced with noisy stimuli and unequal rewards?
Abstract
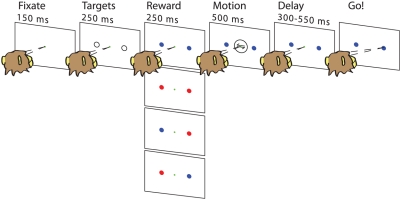
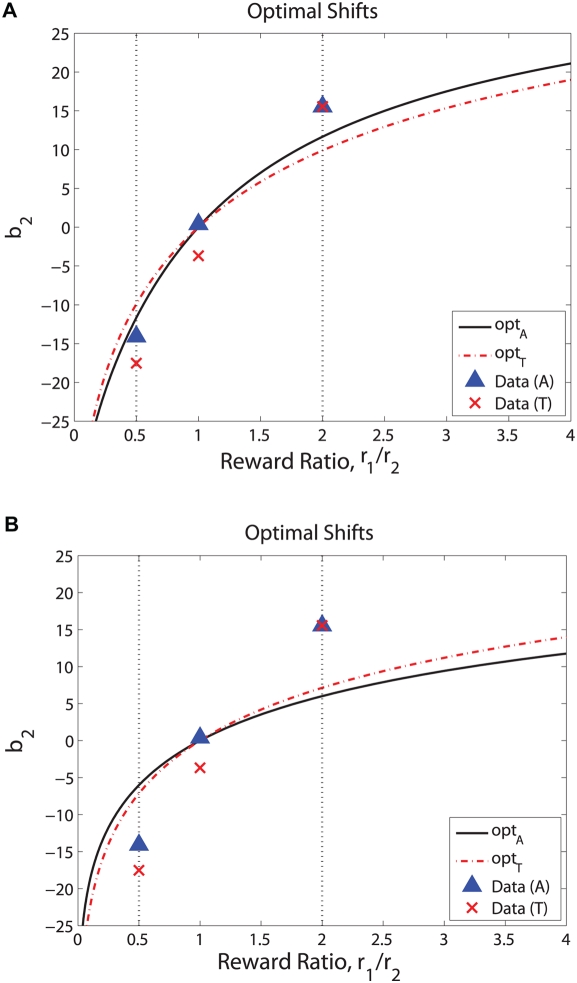
We review the leaky competing accumulator model for two-alternative forced-choice decisions with cued responses, and propose extensions to account for the influence of unequal rewards. Assuming that stimulus information is integrated until the cue to respond arrives and that firing rates of stimulus-selective neurons remain well within physiological bounds, the model reduces to an Ornstein-Uhlenbeck (OU) process that yields explicit expressions for the psychometric function that describes accuracy. From these we compute strategies that optimize the rewards expected over blocks of trials administered with mixed difficulty and reward contingencies. The psychometric function is characterized by two parameters: its midpoint slope, which quantifies a subject's ability to extract signal from noise, and its shift, which measures the bias applied to account for unequal rewards. We fit these to data from two monkeys performing the moving dots task with mixed coherences and reward schedules. We find that their behaviors averaged over multiple sessions are close to optimal, with shifts erring in the direction of smaller penalties. We propose two methods for biasing the OU process to produce such shifts.
Conflict of interest statement
The authors have declared that no competing interests exist.
Figures
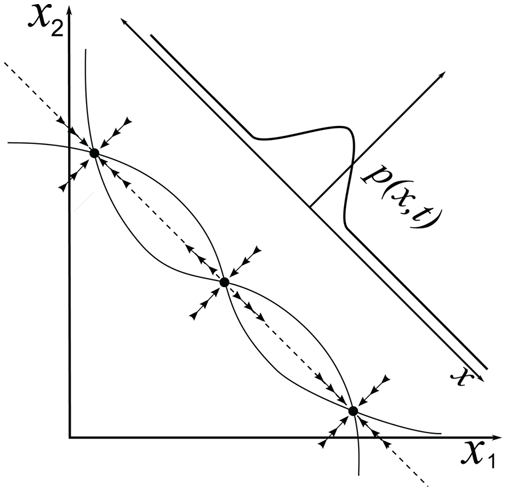
 of reduced OU model, with associated probability distribution
  of sample paths.
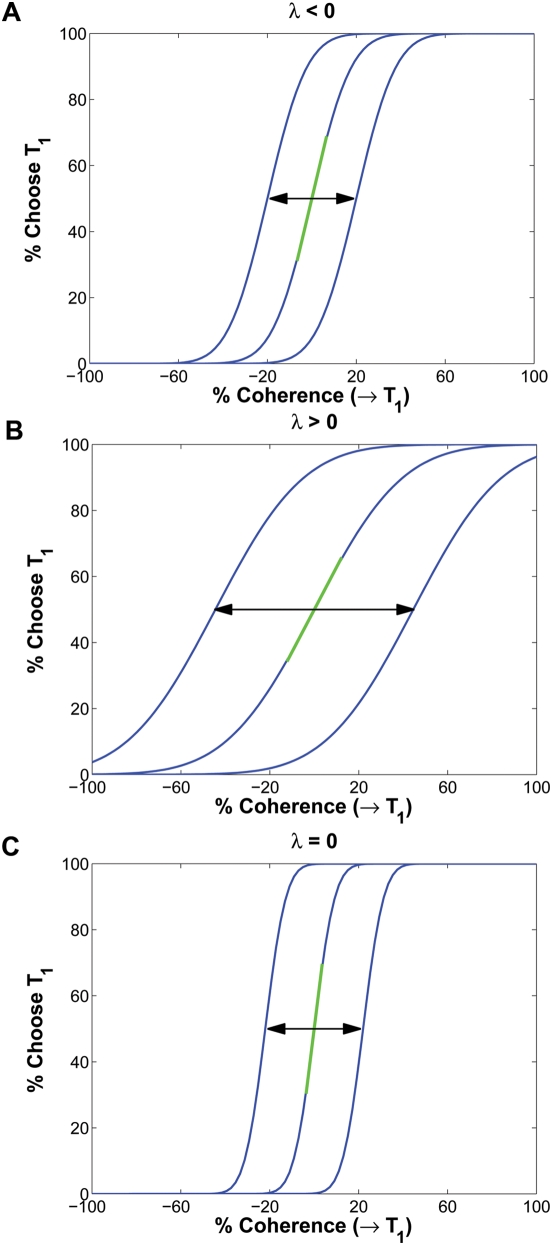
 ; (B)
; (B)  ; (C)
; (C)  ; each panel shows the cases
  and −0.1 (left to right). Remaining parameters are
  and
and  (arbitrary time units). Green lines indicate slopes for zero bias; arrows show shifts.
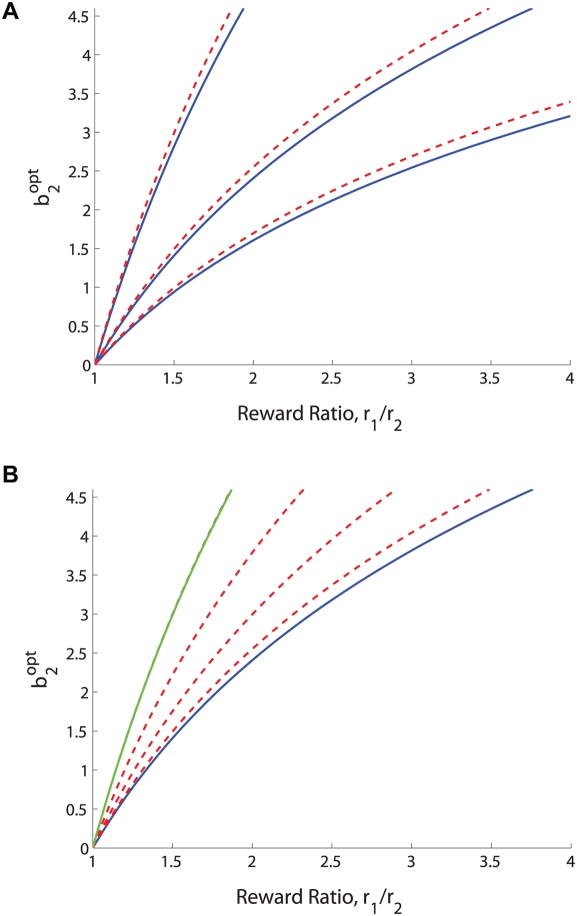
 = 10; 20 and 30% (top left to bottom right, solid blue), and [C
1;C
2] = [5; 15]; [15; 25] and [25; 35] (top left to bottom right, dashed red). (B): Coherence bands centered on
= 10; 20 and 30% (top left to bottom right, solid blue), and [C
1;C
2] = [5; 15]; [15; 25] and [25; 35] (top left to bottom right, dashed red). (B): Coherence bands centered on  = 20% (solid blue curve) with widths 10; 20; 30 and 40% (bottom left to top right, dashed red). Approximation of Eq. (30) shown in green. The slope b
1 is fixed at 0.06 throughout.
= 20% (solid blue curve) with widths 10; 20; 30 and 40% (bottom left to top right, dashed red). Approximation of Eq. (30) shown in green. The slope b
1 is fixed at 0.06 throughout.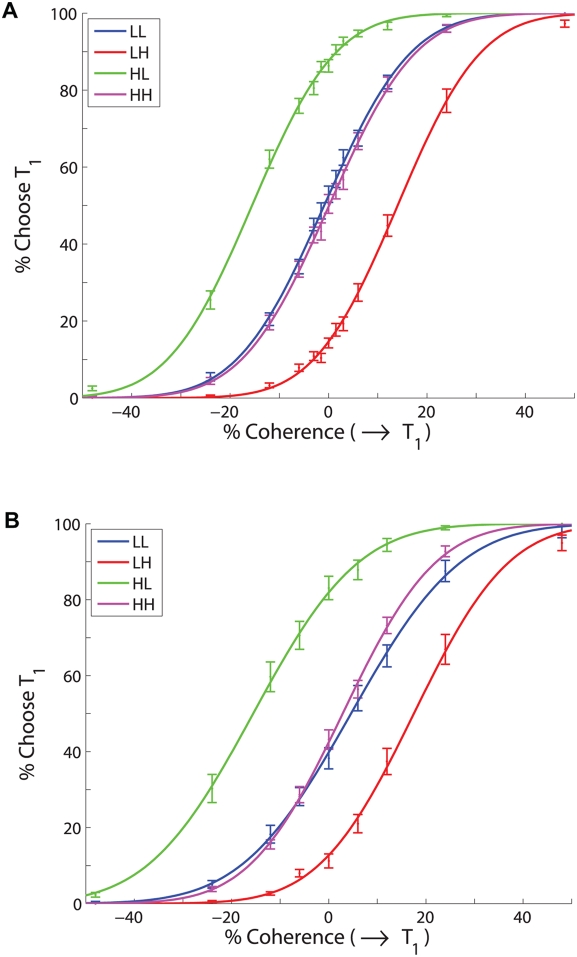
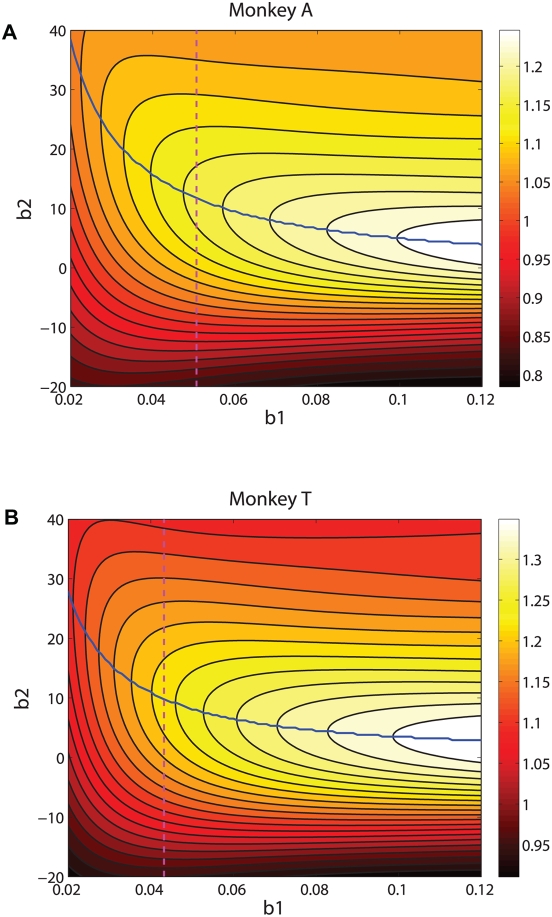
 values fitted to pooled equal rewards data. Note that gradients in
  in either direction away from ridges of maximum expected rewards (blue curves) become smaller as
  decreases, that gradients are smaller for overshifts in
  than for undershifts, that this asymmetry increases as
  decreases, and that gradients are steeper for T than for A. See text for discussion.
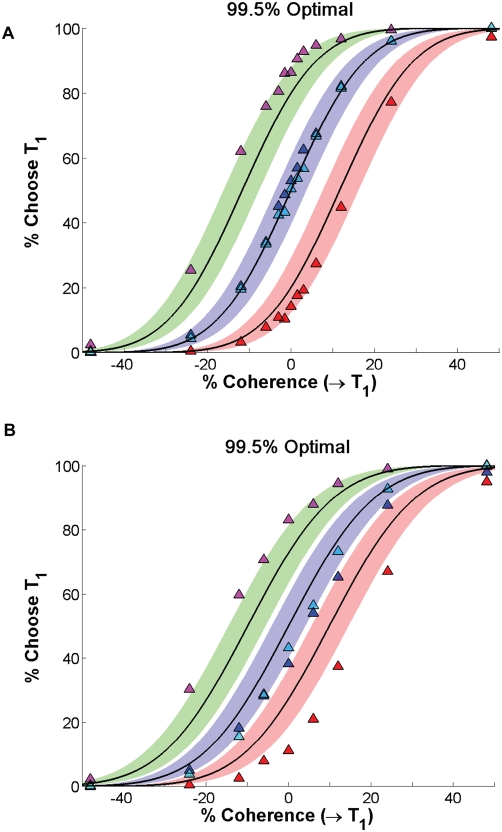
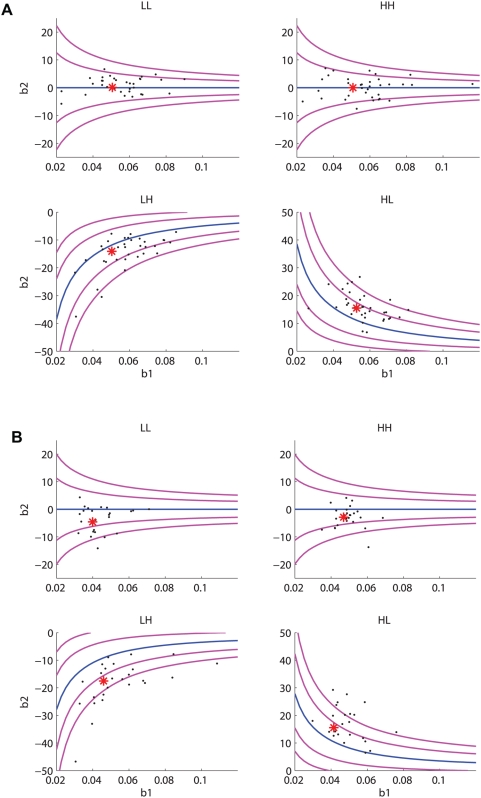
 values for given
  values (central blue curves) and values that gain 99% and 97% of maximum rewards are also shown (flanking magenta curves closest to and farthest from blue curves, respectively).
References
-
- Schall J. Neural basis of deciding, choosing and acting. Nat Rev Neurosci. 2001;2:33–42. - PubMed
-
- Gold J, Shadlen M. Neural computations that underlie decisions about sensory stimuli. Trends Cognitive Sci. 2001;5:10–16. - PubMed
-
- Mazurek M, Roitman J, Ditterich J, Shadlen M. A role for neural integrators in perceptual decision making. Cereb Cortex. 2003;13:891–898. - PubMed
-
- Smith P, Ratcliff R. Psychology and neurobiology of simple decisions. Trends Neurosci. 2004;27:161–168. - PubMed
Publication types
MeSH terms
Grants and funding
LinkOut - more resources
Full Text Sources
