Review
. 2009 Jun;22(1):7-12.
doi: 10.1007/s10548-009-0079-4. Epub 2009 Feb 12.

Electromyogenic artifacts and electroencephalographic inferences

Affiliations
Review

Electromyogenic artifacts and electroencephalographic inferences

Alexander J Shackman et al. Brain Topogr. 2009 Jun.

Abstract

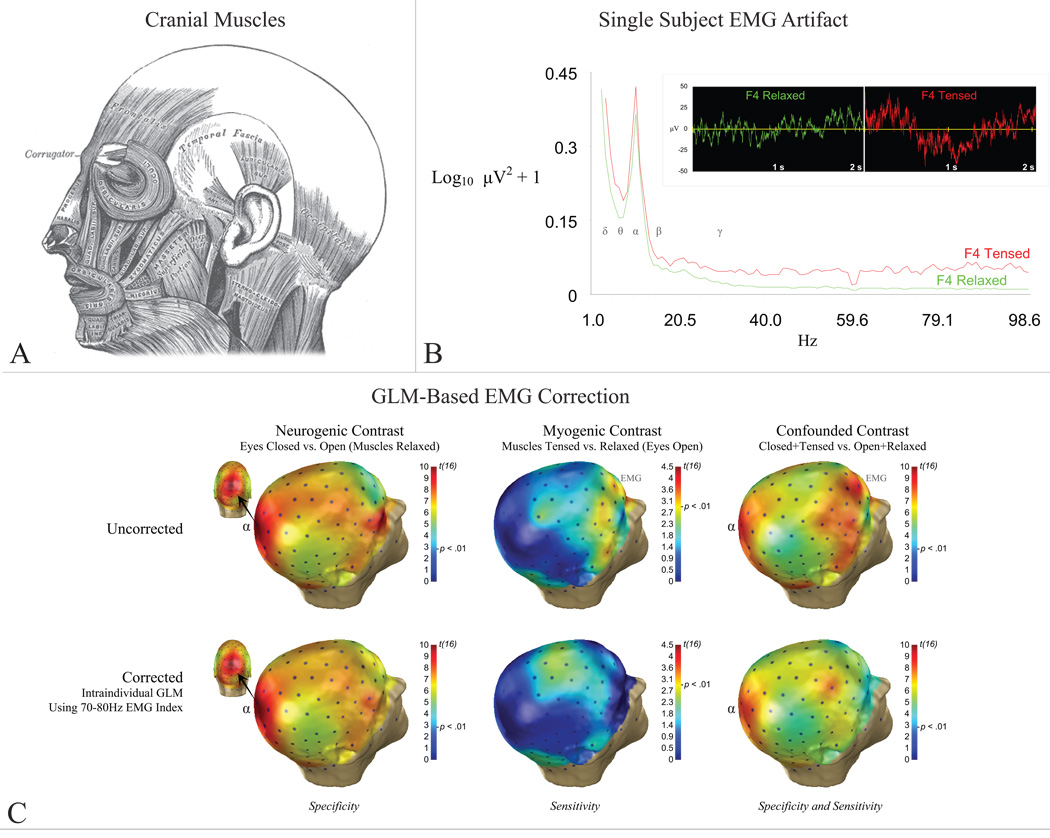
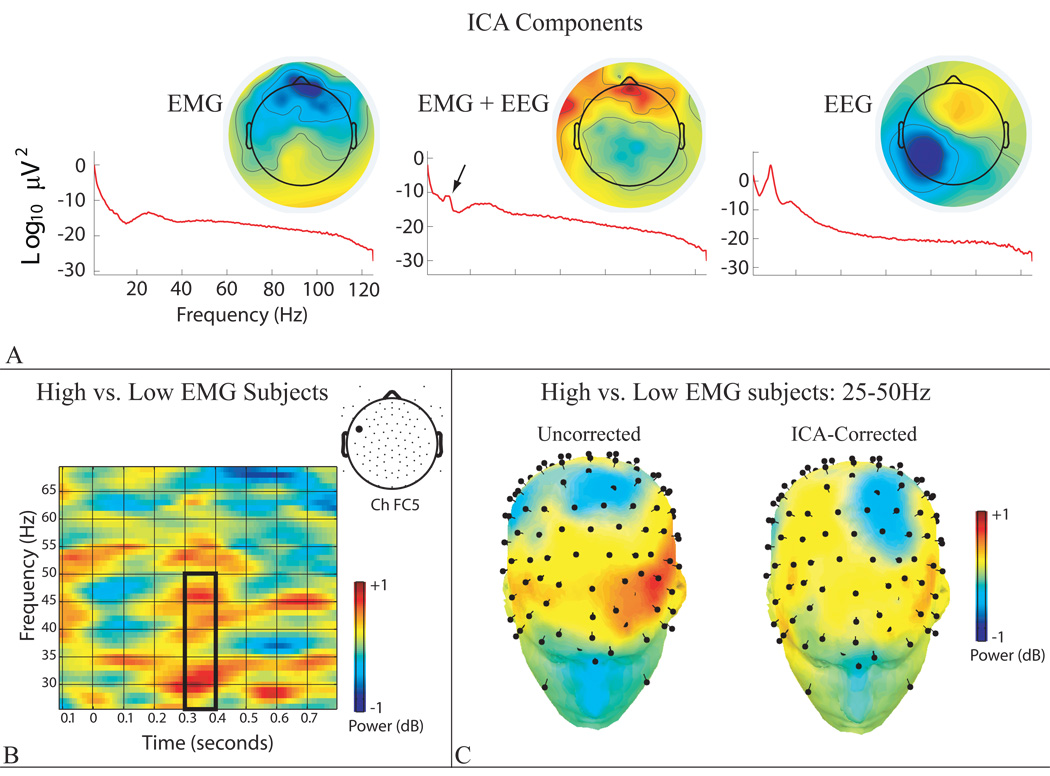
Muscle or electromyogenic (EMG) artifact poses a serious risk to inferential validity for any electroencephalography (EEG) investigation in the frequency-domain owing to its high amplitude, broad spectrum, and sensitivity to psychological processes of interest. Even weak EMG is detectable across the scalp in frequencies as low as the alpha band. Given these hazards, there is substantial interest in developing EMG correction tools. Unfortunately, most published techniques are subjected to only modest validation attempts, rendering their utility questionable. We review recent work by our laboratory quantitatively investigating the validity of two popular EMG correction techniques, one using the general linear model (GLM), the other using temporal independent component analysis (ICA). We show that intra-individual GLM-based methods represent a sensitive and specific tool for correcting on-going or induced, but not evoked (phase-locked) or source-localized, spectral changes. Preliminary work with ICA shows that it may not represent a panacea for EMG contamination, although further scrutiny is strongly warranted. We conclude by describing emerging methodological trends in this area that are likely to have substantial benefits for basic and applied EEG research.


Figures

Figure 1
Figure 1. EMG and EEG
A) Cranial muscles. B) EMG artifact at right mid-frontal electrode, F4. Main panel: Power densities during muscle tensing/relaxation. EEG bands denoted by greek symbols. Inset: Single-subject time-series after gross artifact rejection, prior to EMG correction. C) Group (n=17) results for the alpha band before (upper row) and after (bottom row) intra-individual, GLM-based EMG correction (adapted from McMenamin et al., in press). Neurogenic alpha activity at parieto-occipital sensors denoted by “α”. Myogenic alpha activity at prefrontal sensors denoted by “EMG.” Intra-individual GLM-based EMG correction preserved neurogenic activity in the absence of EMG (“specificity”) and attenuated EMG in the absence of neurogenic activity (“sensitivity”).
Figure 2
Figure 2. ICA-based EMG correction
A) Power spectra and back-projected scalp topographical maps for representative independent components. Note that the polarity of the maps is arbitrary, with scaling proportional to µV. On the scalp, the back-projected myogenic component (“EMG”) exhibits peak activity at midline frontopolar sensors; the neurogenic component (“EEG”) manifests as a broad anterior-posterior dipole, peaking in the vicinity of the left mastoid; and the mixed-source component (“EMG + EEG”) manifests as localized clusters of activity at sensors along the edge of the face, superimposed upon more broadly distributed posterior midline activity. Arrow indicates a peak in the alpha band, indicative of neurogenic activity. B) Box indicates that High-EMG subjects exhibited greater activity than Low- EMG subjects in the 25–50Hz gamma band (300–400 ms post-stimulus) at channel FC5 (location shown in inset) after ICA-based EMG correction. As detailed in the text, this group difference in evoked “gamma” activity likely reflects residual myogenic activity. C) Spline-interpolated whole-head maps of the group mean difference for the 25–50Hz band. “Pins” denote electrodes. The High-EMG group shows greater activity (shown in red) at the anterior edge of the high-density array before (“Uncorrected”) and, to a lesser degree, after (“ICA-Corrected) EMG correction.

References

    1. Barbati G, Porcaro C, Hadjipapas A, Adjamian P, Pizzella V, Romani GL, Seri S, Tecchio F, Barnes GR. Functional source separation applied to induced visual gamma activity. Hum Brain Mapp. 2008;29:131–141. - PMC - PubMed
    1. Crespo-Garcia M, Atienza M, Cantero JL. Muscle artifact removal from human sleep EEG by using independent component analysis. Ann Biomed Eng. 2008;36:467–475. - PubMed
    1. De Clercq W, Vergult A, Vanrumste B, Van Hees J, Palmini A, Van Paesschen W, Van Huffel S. A new muscle artifact removal technique to improve the interpretation of the ictal scalp electroencephalogram. Conf Proc IEEE Eng Med Biol Soc. 2005;1:944–947. - PubMed
    1. Delorme A, Sejnowski T, Makeig S. Enhanced detection of artifacts in EEG data using higher-order statistics and independent component analysis. Neuroimage. 2007;34:1443–1449. - PMC - PubMed
    1. Fatourechi M, Bashashati A, Ward RK, Birch GE. EMG and EOG artifacts in brain computer interface systems: A survey. Clin Neurophysiol. 2007;118:480–494. - PubMed

Publication types

LinkOut - more resources