. 2009 Apr;61(4):842-50.
doi: 10.1002/mrm.21896.

Magnetic resonance diffusion characteristics of histologically defined prostate cancer in humans

Affiliations

Magnetic resonance diffusion characteristics of histologically defined prostate cancer in humans

Junqian Xu et al. Magn Reson Med. 2009 Apr.

Abstract

The contrast provided by diffusion-sensitive magnetic resonance offers the promise of improved tumor localization in organ-confined human prostate cancer (PCa). Diffusion tensor imaging (DTI) measurements of PCa were performed in vivo, in patients undergoing radical prostatectomy, and later, ex vivo, in the same patients' prostatectomy specimens. The imaging data were coregistered to histological sections of the prostatectomy specimens, thereby enabling unambiguous characterization of diffusion parameters in cancerous and benign tissues. Increased cellularity, and hence decreased luminal spaces, in peripheral zone PCa led to approximately 40% and 50% apparent diffusion policy (ADC) decrease compared with benign peripheral zone tissues in vivo and ex vivo, respectively. In contrast, no significant diffusion anisotropy differences were observed between the cancerous and noncancerous peripheral zone tissues. However, the dense fibromuscular tissues in prostate, such as stromal tissues in benign prostatic hyperplasia in central gland, exhibited high diffusion anisotropy. A tissue classification method is proposed to combine DTI and T2-weighted image contrasts that may provide improved specificity of PCa detection over T2-weighted imaging alone. PCa identified in volume rendered MR images qualitatively correlates well with histologically determined PCa foci.


Figures

FIG. 1
FIG. 1
Overview of histology and MR coregistration scheme. The dashed line represents the semiautomatic thin plate spline (TPS) warping procedure using manually placed control points. The dotted line represents the manual image registration procedure to transform ex vivo coordinates into in vivo T2w coordinates. The solid line represents the unsupervised in vivo image coregistration procedure.
FIG. 2
FIG. 2
a–d: Ex vivo (a,b) and in vivo (c,d) ADC (µm2/ms; a,c) and FA (unitless; b,d) values for each tissue type: (from left to right in each panel) PCa, benign PZ, stromal BPH, and epithelial BPH. *indicates significant differences (P < 0.01).
FIG. 3
FIG. 3
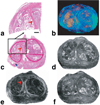
Coregistered images illustrate the tissue microstructure underpinning the MR diffusion characteristics: a: in vivo ADC (0 –2.0 µm2/ms); b: in vivo T2w; c: in vivo color coded FA (0–0.33); d: ex vivo ADC (0 –2.0 µm2/ms); e: H&E slide; f: ex vivo FA (0–0.79). The cancerous and BPH regions in the H&E slide were marked in blue and red, respectively, by a urologic pathologist. Yellow and red arrows indicate regions of PCa and stromal BPH, respectively, as diagnosed by histology. The white arrow in b indicates a T2 hypointense region that could be mistakenly identified as PCa without the additional coregistered diffusion data. The peripheral zone region was delineated in b and mapped onto c in magenta. g–i: High resolution H&E examinations (×10 magnification; scale bar = 100 µm) reveal the microstructures of different types of tissues in (g) benign peripheral zone, (h) PCa, and (i) stromal BPH.
FIG. 4
FIG. 4
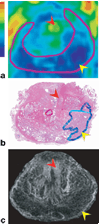
One representative case illustrates the lack of diffusion anisotropy differential between benign and cancerous tissue in the peripheral zone. The cancerous and BPH regions in the H&E slides were marked in blue and red, respectively, by a urologic pathologist. Red and yellow arrows indicate regions of fibromuscular hyperplasia (including periurethral muscles merging with anterior stroma) and carcinoma tissues, respectively, as identified by histology. a: In vivo FA map (0–0.33). b: H&E slide. c: Ex vivo FA map (0–0.79). The magenta line in b delineates the peripheral zone as in Figure 2.
FIG. 5
FIG. 5
One representative case illustrates diffusion anisotropy in a prostate of predominantly epithelial BPH. The cancerous and BPH regions in the H&E slides were marked in blue and red, respectively, by a urologic pathologist. Note that the small cancer was not detected by MR. The region of BPH was largely composed of epithelial nodules with variable size and compactness. Red arrows indicate regions of bundled fibromuscular tissues, respectively, as identified by histology. In panel b, the green (high FA value) regions in the peripheral zone is the result of high FA in the prostate capsule, which in some areas of this case merges with the fibrous tissues surrounding the large BPH nodules. a: Magnified right anterior quadrant of the H&E slide (scale bar = 3 mm); b: Volume rendered ex vivo DTI image (image scale detailed in the text); c: H&E slide; d: ex vivo ADC map (0–0.79); e: ex vivo FA map (0–2.0 µm2/ms); f: ex vivo T2w image.
FIG. 6
FIG. 6
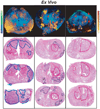
Ex vivo diffusion tensor images were coregistered with step-sectioned histology slides from three representative specimens (each column) with different tumor sizes. PCa identified on the volume rendered DTI (projected view) closely correlated with those seen in histology. The histologically defined PCa extents and stages (from left to right in each panel) are 40% T3b, 16% T2c, and 4% T2c. The cancerous and BPH regions in the H&E slides were marked in blue/black and red, respectively, by a urologic pathologist. In the MR images, the ADC (0–0.50 µm2/ms), and FA (0.39 –1.0) values were imported into the yellow–orange and green–blue channels, respectively. Bright yellow–orange regions in the MR images were identified as carcinoma determined by ADC threshold (ex vivo PCa mean ADC + SD). Red and yellow arrows indicate regions of fibromuscular and carcinoma tissues, respectively, as identified by both the histology and the coregistered diffusion contrast in the MR images. Pairs of ejaculatory ducts with high ADC value (color scale irrelevant) were segmented from the ADC map separately. Regions of low ADC values at the edge of the prostate specimen in the rightmost case were artifacts caused by air bubbles attached to the prostate capsule.
FIG. 7
FIG. 7
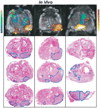
In vivo diffusion tensor images were coregistered with step-sectioned histology slides from three representative specimens (each column) with different tumor sizes. PCa identified on the volume rendered DTI (projected view with a representative T2w image as background), closely correlated with those seen in histology. The histologically defined PCa extents and stages (from left to right in each panel) are 15% T3a, 40% T3a, and 20% T3a. The cancerous and BPH regions in the H&E slides were marked in blue and red, respectively, by a urologic pathologist. In the MR images, the ADC (0–1.15 µm2/ms), and FA (0–0.41) values were imported into the yellow–orange and green–blue channels, respectively. Bright yellow–orange regions in the MR images were identified as carcinoma determined by ADC threshold (in vivo PCa mean ADC + SD). Red and yellow arrows indicate regions of fibromuscular and carcinoma tissues, respectively, as identified by both the histology and the coregistered diffusion contrast in the MR images.

References

    1. Jemal A, Siegel R, Ward E, Murray T, Xu J, Smigal C, Thun MJ. Cancer statistics, 2006. CA Cancer J Clin. 2006;56:106–130. - PubMed
    1. Kantoff PW, Rarroll PR, D’Amico AV, editors. Prostate cancer: principles & practice. 1st ed. Philadelphia: Lippincott Williams & Wilkins; 2002. pp. 278–280.
    1. Keetch DW, Catalona WJ, Smith DS. Serial prostatic biopsies in men with persistently elevated serum prostate specific antigen values. J Urol. 1994;151:1571–1574. - PubMed
    1. Katz AE, Rewcastle JC. The current and potential role of cryoablation as a primary therapy for localized prostate cancer. Curr Oncol Rep. 2003;5:231–238. - PubMed
    1. Guckenberger M, Flentje M. Intensity-modulated radiotherapy (IMRT) of localized prostate cancer: a review and future perspectives. Strahlenther Onkol. 2007;183:57–62. - PubMed

Publication types