. 2009 May 1;419(3):611-8.
doi: 10.1042/BJ20081888.

Lipid phosphate phosphohydrolase type 1 (LPP1) degrades extracellular lysophosphatidic acid in vivo

Affiliations

Lipid phosphate phosphohydrolase type 1 (LPP1) degrades extracellular lysophosphatidic acid in vivo

Jose L Tomsig et al. Biochem J. .

Abstract

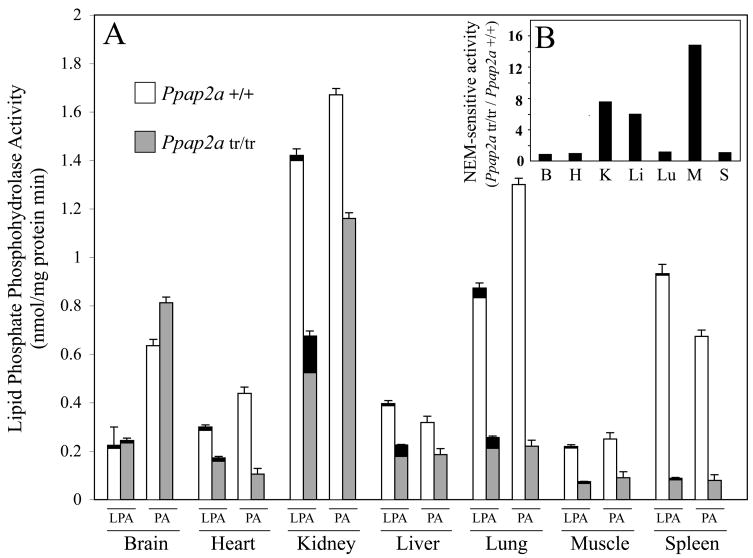
LPA (lysophosphatidic acid) is a lipid mediator that stimulates cell proliferation and growth, and is involved in physiological and pathological processes such as wound healing, platelet activation, angiogenesis and the growth of tumours. Therefore defining the mechanisms of LPA production and degradation are of interest in understanding the regulation of these processes. Extracellular LPA synthesis is relatively well understood, whereas the mechanisms of its degradation are not. One route of LPA degradation is dephosphorylation. A candidate enzyme is the integral membrane exophosphatase LPP1 (lipid phosphate phosphohydrolase type 1). In the present paper, we report the development of a mouse wherein the LPP1 gene (Ppap2a) was disrupted. The homozygous mice, which are phenotypically unremarkable, generally lack Ppap2a mRNA, and multiple tissues exhibit a substantial (35-95%) reduction in LPA phosphatase activity. Compared with wild-type littermates, Ppap2a(tr/tr) animals have increased levels of plasma LPA, and LPA injected intravenously is metabolized at a 4-fold lower rate. Our results demonstrate that LPA is rapidly metabolized in the bloodstream and that LPP1 is an important determinant of this turnover. These results indicate that LPP1 is a catabolic enzyme for LPA in vivo.


Figures

FIGURE 1
FIGURE 1. Structure and characterization of the normal and trapped Ppap2a mouse genes
A schematic representation of the normal and trapped Ppap2a alleles are shown in A. The wild type Ppap2a gene consist of six exons (numbered 1 to 6 in figure) located on chromosome 13. Two isoforms arise by alternative splicing of two different exons 2 (2.1 and 2.2). Mice used in this study harbor an exon trapping element (“Exon Trap” in figure) between exons 1 and 2 and therefore generate a truncated mRNA (“Trapped Ppap2a” in figure) consisting of exon 1 spliced to the coding sequence of the trapping element followed by a poly(A) sequence. Because insertion occurred upstream of exons 2, only one trapped isoform exists. The exact location of the trapping element was determined by genomic DNA sequencing and found to be some 25,600 bp downstream of the 5′ end of the gene (about 75% the length of intron 1). Sequence at the insertion point shows an intervening 5-nucleotide sequence of unknown origin (“unk”) between the Ppap2a gene and the trap element sequence (“pGT1Lxf”). Genotyping was carried out by PCR amplification of genomic DNA using a forward primer complementary to a sequence upstream of the insertion point, and two reverse primers corresponding to sequences downstream in the normal and in the trapped gene. Expected products sizes were 675 bp and 931 bp for the normal and trapped genes respectively. The analysis of PCR products by agarose gel electrophoresis for homozygous (Ppap2atr/tr, “HO” in figure), heterozygous(Ppap2a+/tr,“HE” in figure) and wild type (Ppap2a+/+, “WT” in figure) animals using the indicated combinations of forward and reverse primers is shown in B. In A, the relative positions of the exons and the trap element are shown according to their actual locations within the gene, exon sizes however have been exaggerated for clarity (they constitute only about 2% of the gene).
FIGURE 2
FIGURE 2. LPP1 and LPP3 mRNA expression in selected organs of Ppap2atr/tr and Ppap2a+/+ mice
The expression of LPP1 and LPP3 mRNA was measured by Real-Time RT-PCR in Ppap2atr/tr and Ppap2a+/+ mice. In the case of LPP1, appropriate primers were used to obtain the combined expression of both isoforms (see Results). mRNA expression for LPP1 and LPP3 was normalized by the expression of the 18s ribosomal RNA gene. The main figure shows the expression of mRNA for LPP1 (gray bars) and LPP3 (white bars) as a ratio (Ppap2atr/tr/Ppap2a+/+). Data correspond to the average ± S.D. of three ratios measured in three different pairs of animals (Note the split y axis). Inset (top right) shows the expression of LPP1 mRNA in the brain, liver, kidney and spleen (“B”, “L”, “K” and “S” in figure) of Ppap2atr/tr and Ppap2a+/+ mice. In this case a standard PCR reaction was carried out for 33 cycles using a forward primer anchored to exon 1 and a reverse primer anchored to exons 3 and 4. The expected molecular mass of the PCR product is 531 bp.
FIGURE 3
FIGURE 3. Lipid phosphate phosphohydrolase activity of selected organs of Ppap2atr/tr and Ppap2a+/+ mice
The lipid phosphate phosphohydrolase activity of Ppap2a+/+ and Ppap2atr/tr mice was measured as the ability of organ homogenates to release [32P]H3PO4 from 32P-labeled LPA or PA in a Triton X-100 mixed micelles assay. Main graph (A) shows the lipid phosphate phosphohydrolase activity of Ppap2a+/+ (white bars) and Ppap2atr/tr (gray bars) mice using either LPA or PA as substrates as indicated in the figure. In the case of LPA, activity was also measured under conditions that abolish the NEM-sensitive, Mg2+-dependent component of the total activity. This is shown as composite LPA bars that represent the total activity as the full height of the bar and the NEM-insensitive, Mg2+-independent activity as the height of the bottom part. Their difference, i.e. the NEM-sensitive, Mg2+-dependent portion, is represented by the blackened parts of the bars. Data were obtained from two sets of three animals (three Ppap2a+/+ and three Ppap2atr/tr). Activity is expressed as nmole of [32P]H3PO4 released per mg of protein in one minute. Values represent the average ± S.D. for each genotype (n=3). In B, the NEM-sensitive, Mg2+-dependent activity observed in organs of Ppap2atr/tr animals is expressed in relation to the activities observed in the corresponding organs of Ppap2a+/+ animals, i.e. the Ppap2atr/tr/Ppap2a+/+ ratio of NEM-sensitive, Mg2+-dependent activities. For clarity, organs are identified in this case with the initial letter or letters of the their names (“B”: Brain, “H”: Heart, etc).
FIGURE 4
FIGURE 4. Lipid phosphate phosphohydrolase activity of intact cells and tissues from Ppap2atr/tr and Ppap2a+/+ mice
The lipid phosphate phosphohydrolase activity of small tissue slices and spleen cells from Ppap2a+/+ and Ppap2atr/tr mice was measured as their ability to release [32P]H3PO4 from [32P]LPA. Slices and cells were incubated in a physiological solution containing [32P]LPA for a similar period of time for each tissue or cell type. The leftmost group of bars (indicated as “slices” in the figure) show the phosphohydrolase activity of tissue slices prepared from Ppap2a+/+ (white bars) or Ppap2atr/tr (gray bars) mice organs. The group of bars on the right indicated as “Spleen cells” in the figure show the phosphohydrolase activity of spleen cells obtained by mechanical disruption of spleens from Ppap2a+/+ (white bars) or Ppap2atr/tr (gray bars) mice. Bars labeled as “Total” represent the activity of a crude preparation of cells, i.e. all the cells that were obtained. “Splenocytes” represents the activity of cell population constituted mostly by lymphocytes that is obtained by removing the red blood cells from a crude preparation by osmotic lysis. Values represent the average ± S.D of four measurements obtained from tissues of two animals and are expressed as nmole of 32P[H3 PO4] released per mg of protein in one minute.
FIGURE 5
FIGURE 5. Plasma levels of LPA in Ppap2atr/tr and Ppap2a+/+ mice
The levels of plasma LPA in Ppap2atr/tr, Ppap2a+/+ and C57BL/6j mice were measured by liquid chromatography-mass spectrometry. Each dot represents a single measurement from an individual animal, horizontal bars represent the average. Data for Ppap2atr/tr and Ppap2a+/+ animals were either F1N1 or F1N5 generations. The biologic and inter-assay variability was assessed in a homogenous C57BL/6j mouse population (4.5 month old females). Values for these animals, depicted as “B6”, were 0.35 ± 0.098 μM (n =7). To assess intra-assay variability, portions of the same plasma samples were mixed and assayed repeatedly (“B6mix”). Values in this case were 0.30 ± 0.046 μM (n = 6). Values for F1N1 and F1N5 Ppap2atr/tr mice (n = 5 and n=25 respectively) were significantly higher (p < 0.05, Student’s t test) than those for F1N1 and F1N5 Ppap2a+/+ mice (n = 5 and n=6 respectively) as indicated in the figure. (Note the split x axis and the magnified y axis (on right), which applies to C57BL/6j and F1N5 animals.)
FIGURE 6
FIGURE 6. Ex vivo and in vivo clearance of LPA in Ppap2atr/tr and Ppap2a+/+ mice
The clearance of LPA was measured by observing the disappearance of [32P]LPA in plasma obtained from blood samples that had been supplemented with tracer amounts [32P]LPA ex vivo or in vivo. For ex vivo experiments, blood samples anticoagulated with EDTA were supplemented with [32P]LPA and incubated for 0, 5, 15 and 30 min at 37°C. Addition of [32P]LPA was accomplished by adding a small amount (5% of the volume of blood) of either [32P]LPA-containing plasma from another animal of the same genotype or a solution consisting of 0.9 % NaCl, 0.1% FAF-BSA and [32P]LPA. In vivo experiments were carried out by injecting mice through the tail vein with 150 μl of either [32P]LPA-containing plasma from another animal of the same genotype or a solution consisting of sterile 0.9 % NaCl, 0.1% FAF-BSA and [32P]LPA. After injection, a series blood samples (~ 50–100 μl) were obtained by retro-orbital bleeding. For practical reasons, the first sample could not be obtained earlier than 2–3 min after injections. This first blood sample was considered to be the “time zero” sample and therefore subsequent samples were taken 5, 15 and 30 min after the moment the first sample was obtained (rather than after the moment of injection). In both cases, ex vivo and in vivo, plasma was immediately obtained from each timed blood sample by centrifugation and then extracted with 1-butanol under acidic conditions. Butanol extracts were then analyzed by TLC. The amount of [32P]LPA present in each sample was measured by scraping off the [32P]LPA bands from the developed TLC plates and determining their 32P content by liquid scintillation spectrometry. A and B show the results of the ex vivo and in vivo experiments respectively by expressing the observed amounts [32P]LPA as a percentage of the “time zero” value. In A, the disappearance of [32P]LPA ex vivo in blood samples from Ppap2a+/+ mice (white symbols) and Ppap2atr/tr mice (gray symbols) is shown. Addition of [32P]LPA was carried out as described above by adding plasma (square symbols or “Plasma” in figure) or saline solution (triangular symbols or “Saline” in figure). Each value corresponds to the average ± S.D. of three measurements obtained in blood samples from three different animals. Values for plasma and saline were obtained in blood from the same animals. Plasma used for additions was a combined plasma preparation from two animals. B shows the in vivo experiments in which the clearance of [32P]LPA in the bloodstream of live Ppap2a+/+ (white symbols) and Ppap2atr/tr (gray symbols) mice was measured. Administration of [32P]LPA was carried out as described above by injecting plasma (square symbols or “Plasma” in figure) or saline solution (triangular and circular symbols or “Saline” in figure). Values for Ppap2atr/tr mice injected with saline (gray squares) are the average ± S.D. of three measurements obtained in three different animals. Values for Ppap2atr/tr mice injected with saline (gray triangles) are single determinations. Values for Ppap2a+/+ mice are single determinations carried out twice with saline (white circles and triangles) and once with plasma (white squares). Because the volume of the blood samples obtained in the in vivo experiments were in general not equal, the observed content of [32P]LPA of each sample was corrected by dividing this value by the volume of the “time zero” blood sample. Each injection of plasma was carried out with plasma obtained from a different animal of the same genotype.

References

    1. Moolenaar WH. Development of our current understanding of bioactive lysophospholipids. Annals NY Acad Sci. 2000;905:1–10. - PubMed
    1. van Meeteren LA, Moolenaar WH. Regulation and biological activities of the autotaxin-LPA axis. Prog Lipid Res. 2007;46:145–160. - PubMed
    1. Anliker B, Chun J. Regulation and biological activities of the autotaxin-LPA axis. J Biol Chem. 2004;279:20555–20558. - PubMed
    1. Reue K, Brindley DN. Multiple roles for lipins/phosphatidate phosphatase enzymes in lipid metabolism. J Lipid Res. 2008;49:2493–503. - PMC - PubMed
    1. Brindley DN, Pilquil C. Lipid phosphate phosphatases and signaling. J Lipid Res. 2008 doi: 10.1194/jlr.R800055-JLR200. Epub ahead of print. - DOI - PMC - PubMed

Publication types