

Graphical and numerical evaluation of continuous glucose sensing time lag
- PMID: 19216687
- PMCID: PMC2939841
- DOI: 10.1089/dia.2008.0044
Graphical and numerical evaluation of continuous glucose sensing time lag
Abstract
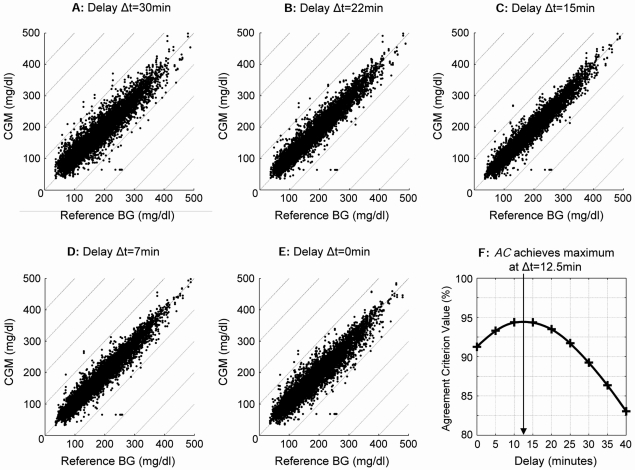
Aim: This study introduces a new method for graphical and numerical evaluation of time lags typically associated with subcutaneous glucose sensing, based on Poincaré-type plot and a maximum statistical agreement criterion.
Methods: The proposed method is illustrated by retrospective analysis of 56 continuous glucose monitor (CGM) time series collected by the FreeStyle Navigator (Abbott Diabetes Care, Alameda, CA) from 28 patients with type 1 diabetes mellitus, each wearing simultaneously two sensors (on arm and abdomen) and parallel reference blood glucose (BG) collected with a reference YSI (Yellow Springs, OH) analyzer every 15 min. The average duration of a time series was 111 h; there were approximately 10,000 sensor-reference data pairs.
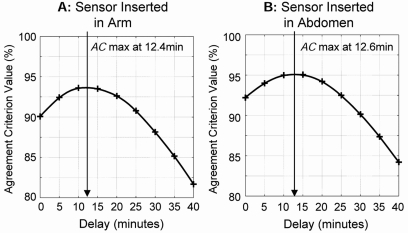
Results: When sliding in time CGM readings versus BG, the point of minimal spread of a Poincaré-type plot marks visually the time of CGM delay. The same point is numerically estimated by minimizing the distance between BG and CGM readings. The average observed time lag between reference BG and CGM was 12.5 min. Stratified by BG rate of change, the time lag was longer (16.8 min) when BG was falling, compared to steady or rising BG (11.7 min and 9.9 min, respectively) (P < 0.005). The time lags at the two sensor locations were not significantly different: 12.4 min on the arm, 12.6 min on the abdomen.
Conclusions: In this data set, substantial blood-to-sensor time delays were observed, possibly because of both blood-to-interstitial glucose transport and instrumental delay. Analysis of BG-CGM co-dynamics that is free from mathematical approximation of glucose fluctuations resulted in convenient visualization and numerical estimation of these delays.
Figures
References
-
- Rebrin K. Steil GM. van Antwerp WP. Mastrototaro JJ. Subcutaneous glucose predicts plasma glucose independent of insulin: implications for continuous monitoring. Am J Physiol Endocrinol Metab. 1999;277:E561–E571. - PubMed
-
- Rebrin K. Steil GM. Can interstitial glucose assessment replace blood glucose measurements? Diabetes Technol Ther. 2000;2:461–472. - PubMed
-
- Steil GM. Rebrin K. Hariri F. Jinagonda S. Tadros S. Darwin C. Saad MF. Interstitial fluid glucose dynamics during insulin-induced hypoglycaemia. Diabetologia. 2005;48:1833–1840. - PubMed
-
- Boyne M. Silver D. Kaplan J. Saudek C. Timing of changes in interstitial and venous blood glucose measured with a continuous subcutaneous glucose sensor. Diabetes. 2003;52:2790–2794. - PubMed
Publication types
MeSH terms
Substances
Grants and funding
LinkOut - more resources
Full Text Sources
Other Literature Sources
Medical
