. 2009:453:145-58.
doi: 10.1016/S0076-6879(08)04007-X.

Live-cell imaging of autophagy induction and autophagosome-lysosome fusion in primary cultured neurons

Affiliations

Live-cell imaging of autophagy induction and autophagosome-lysosome fusion in primary cultured neurons

Mona Bains et al. Methods Enzymol. 2009.

Abstract

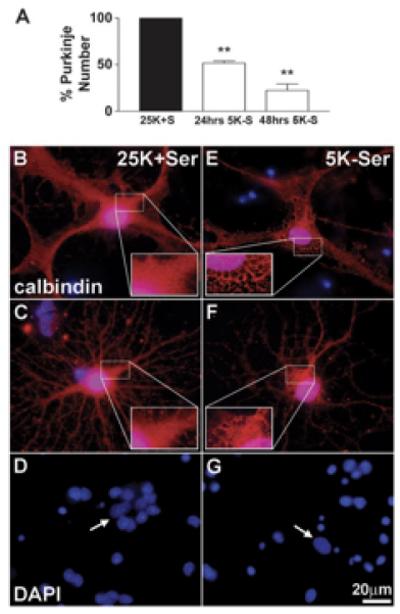
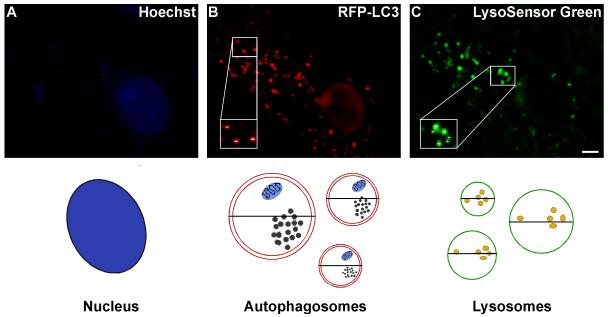
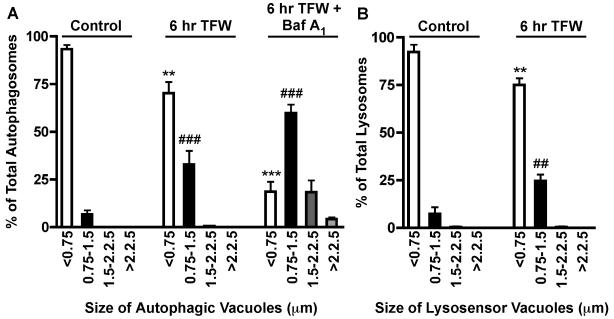
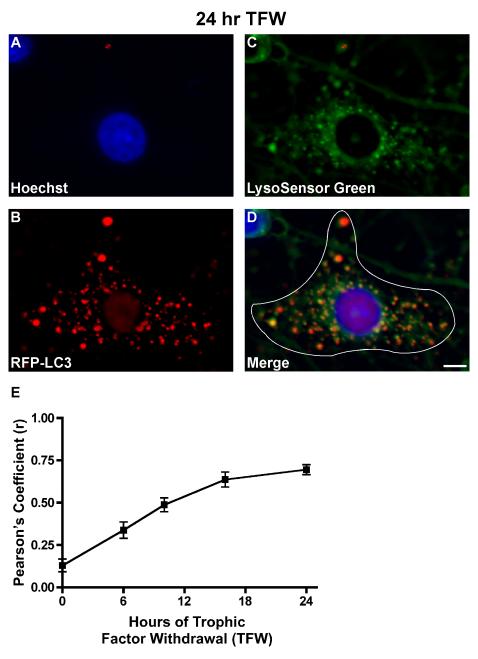
The discovery that impaired autophagy is linked to a wide variety of prominent diseases including cancer and neurodegeneration has led to an explosion of research in this area. Methodologies that allow investigators to observe and quantify the autophagic process will clearly advance knowledge of how this process contributes to the pathophysiology of many clinical disorders. The recent identification of essential autophagy genes in higher eukaryotes has made it possible to analyze autophagy in mammalian cells that express autophagy proteins tagged with fluorescent markers. This chapter describes such methods using primary cultured neurons that undergo up-regulation of autophagy when trophic factors are removed from their medium. The prolonged up-regulated autophagy, in turn, contributes to the death of these neurons, thus providing a model to examine the relationship between enhanced autophagy and cell death. Neurons are isolated from the cerebellum of postnatal day 7 rat pups and cultured in the presence of trophic factors and depolarizing concentrations of potassium. Once established, the neurons are transfected with an adeno-viral vector expressing MAP1-LC3 with red fluorescent protein (RFP). MAP1-LC3 is the mammalian homolog of the yeast autophagosomal marker Atg8 and when tagged to GFP or RFP, it is the most widely used marker for autophagosomes. Once expression is stable, autophagy is induced by removing trophic factors. At various time points after inducing autophagy, the neurons are stained with LysoSensor Green (a pH-dependent lysosome marker) and Hoechst (a DNA marker) and subjected to live-cell imaging. In some cases, time-lapse imaging is used to examine the stepwise process of autophagy in live neurons.


Figures

Figure 1
Figure 1. Trophic factor withdrawal induces a non-apoptotic death of Purkinje neurons
(A) Calbindin-positive Purkinje cells plotted as a percent of control. Following 24 hr or 48 hr of TFW, 51.7± 2.2% and 22.3 ± 7.0% of Purkinje neurons survive, respectively, as compared to controls (** indicates significant difference from 25K+S control at p<0.01). (B-G) Cells fixed and stained with polyclonal antibodies against Calbindin D-28K (in red) and the nuclear dye, DAPI (in blue). The remaining Purkinje neurons showed markedly different morphology than control cells, characterized by extensive cytoplasmic vacuolation (compare control cells B,C to trophic factor-deprived cells E,F). In contrast to granule neurons, which demonstrated substantial nuclear condensation and fragmentation characteristic of apoptosis (compare D to G), Purkinje neurons showed no obvious signs of nuclear condensation or fragmentation (compare nuclei indicated by arrows in D and G). This figure was previously published in Florez-McClure et al., (2004), and is reprinted with permission from The Society for Neuroscience, J. Neuroscience.
Figure 2
Figure 2. Schematic for measuring the size of autophagy-positive vacuoles
Autophagosome and lysosome vacuole size are quantified by measuring the diameters of all visible RFP-LC3- and LysoSensor Green-positive vacuoles. At least 7 images are collected via live cell microscopy per treatment. Using the Slidebook magnification tool, images are increased in size so that the diameter (μm) of each vacuole can be easily measured using the ruler tool. The diameters of all visible vacuoles in 7-12 Purkinje neurons per treatment are measured, which reflects diameter measurements of ∼200 vacuoles per treatment. The total number of vacuoles are then counted and categorized as small (<0.75), medium (0.75-1.5) large (1.5-2.25) or extra large (>2.25) based on their diameter, and the size distribution is graphed as percent of total vacuoles within the indicated size ranges. Images shown represent a 6 hr treatment of cerebellar cultures in TFW medium. Scale bar represents, 5 μm.
Figure 3
Figure 3. Accumulation of Autophagic Vacuoles in Purkinje Neurons
Purkinje neurons were maintained in control medium or TFW medium for 24 hr in the absence and presence of bafilomycin A1. Autophagosome and lysosome vacuole size were quantified by measuring the diameters of all RFP-LC3-positive vacuoles (A) and LysoSensor Green-positive vacuoles (B) in 7-12 Purkinje neurons per treatment. The size distribution was graphed as percent of total vacuoles within the indicated size ranges. For bafilomycin A1-treated conditions, the total number of vacuoles per Purkinje neuron was also determined. **p<0.01 and ***p<0.001 compared to <0.75 μm control, ##p<0.01 and ###p<0.001 compared to 0.75-1.5 μm control. one-way ANOVA, Tukey’s post hoc test.
Figure 4
Figure 4. (A-D) Schematic for measuring autophagosome-to-lysosome fusion
At least 7-12 live cell images are captured per treatment condition (n=2 for at least three independent experiments). Fusion is measured as the degree of co-localization between the two fluorescent flours, Cy3 (RFP-LC3) and FITC (LysoSensor Green), which represents the fused vesicles or autolysosome. For each captured Purkinje neuron, a mask is created in Slidebook by outlining the perimeter of the neuron as shown in D. The Pearson’s correlation coefficient (r) is then determined between the FITC and Cy3 channels by choosing cross channel statistics from the Statistics option under the Mask menu. The degree of co-localized vesicles can be visualized in image D as yellow punctate staining. Images shown represent a 24 hr treatment of cerebellar cultures in TFW medium. Scale bar represents, 5 μm. (E) Purkinje neuron autophagy fusion rate. RFP-LC3-infected cerebellar cultures were subjected to a time course of TFW (0, 6, 10, 16, 24 hr). Coverslips were stained with Hoechst to visualize cellular nuclei and LysoSensor Green to visualize lysosomes, and images were captured via live cell imaging. Co-localization between RFP-LC3-positive vacuoles and Lysosensor Green-positive vacuoles was quantified using Pearson’s correlation coefficient analysis in Slidebook 4.2. The degree of RFP-LC3 and LysoSensor Green co-localization, expressed in Pearson’s correlation coefficient (r) increased with time and at 24 hr was 0.70, indicative of increased fusion. This time-dependent increase in fusion rate correlates with an increased accumulation of large autophagic vesicles at 24 hr TFW (data not shown).

References

    1. Backer JM. The regulation and function of Class III PI3Ks: novel roles for Vps34. Biochem. J. 2008;410:1–17. - PubMed
    1. Bampton ET, Goemans CG, Niranjan D, Mizushima N, Tolkovsky AM. The dynamics of autophagy visualized in live cells: from autophagosome formation to fusion with endo/lysosomes. Autophagy. 2004;1:23–36. - PubMed
    1. Cuervo AM. Autophagy: in sickness and in health. Trends in Cell Biology. 2004;14:70–77. - PubMed
    1. D’Mello SR, Galli C, Ciotti T, Calissano P. Induction of apoptosis in cerebellar granule neurons by low potassium: inhibition of death by insulin-like growth factor I and cAMP. Proc Natl Acad Sci USA. 1993;90:10989–10993. - PMC - PubMed
    1. Fass E, Shvets E, Degani I, Hirschberg K, Elazar Z. Microtubules support production of starvation-induced autophagosomes but not their targeting and fusion with lysosomes. J Biol Chem. 2006;281:36303–36316. - PubMed

Publication types

LinkOut - more resources