. 2009:453:217-49.
doi: 10.1016/S0076-6879(08)04011-1.

Autophagy in neurite injury and neurodegeneration: in vitro and in vivo models

Affiliations

Autophagy in neurite injury and neurodegeneration: in vitro and in vivo models

Charleen T Chu et al. Methods Enzymol. 2009.

Abstract

Recent advances indicate that maintaining a balanced level of autophagy is critically important for neuronal health and function. Pathologic dysregulation of macroautophagy has been implicated in synaptic dysfunction, cellular stress, and neuronal cell death. Autophagosomes and autolysosomes are induced in acute and chronic neurological disorders including stroke, brain trauma, neurotoxin injury, Parkinson's, Alzheimer's, Huntington's, motor neuron, prion, lysosomal storage, and other neurodegenerative diseases. Compared to other cell types, neuronal autophagy research presents particular challenges that may be addressed through still evolving techniques. Neuronal function depends upon maintenance of axons and dendrites (collectively known as neurites) that extend for great distances from the cell body. Both autophagy and mitochondrial content have been implicated in regulation of neurite length and function in physiological (plasticity) and pathological remodeling. Here, we highlight several molecular cell biological and imaging methods to study autophagy and mitophagy in neuritic and somatic compartments of differentiated neuronal cell lines and primary neuron cultures, using protocols developed in toxic and genetic models of parkinsonian neurodegeneration. In addition, mature neurons can be studied using in vivo protocols for modeling ischemic and traumatic injuries. Future challenges include application of automated computer-assisted image analysis to the axodendritic tree of individual neurons and improving methods for measuring neuronal autophagic flux.


Figures
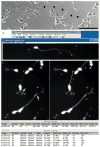
Figure 11.1
Figure 11.1
Using the intensity-tracing algorithm in NIH ImageJ. (A) Phase image of differentiated SH-SY5Y cells showing extensive overlap of processes making it difficult to determine the end of a neuritic process (arrowheads) that merges with processes of other cells. Scale: 100 μm. Transfection of RA/BDNF (B) or RA-differentiated (C) cultures with EGFP-C1 allows visualization of the neuritic arbors associated with individual neurons. (B) Using the NeuronJ plug-in for NIH ImageJ, the user clicks at the base of the neurite and as the mouse (cyan X) is moved toward the distal end, the software automatically follows the subtle curves of the structure allowing the user to simply move the mouse to the end of the structure without having to manually trace it. (C) The arrows in the left panel illustrate examples of branch points, and as seen on the right, the user has input in deciding whether to end the measurement at the branch point for primary segment determinations, or select the longer branch to determine the maximal extent of neurite elongation from the soma. As shown in the data table, individual NeuronJ tracings can be grouped to obtain summated and average lengths of all traced neurites in a group. Multiple neurites extending from a single multipolar neuron may be defined as a group to obtain summated neurite lengths per cell (not shown). The software is compatible with both Macintosh and PC operating systems (Panel B: Windows XP running ImageJ 1.36b and NeuronJ 1.1.0; Panel C: MacBook Pro OSX 10.4.11 running ImageJ 1.38X with Java 1.5.0_13 and NeuronJ 1.2.0).
Figure 11.2
Figure 11.2
Using the Measure Neurites macro. The Measure Neurites macro was used to analyze an epifluorescent micrograph captured at 20X magnification of mouse cortical neurons (7 days in vitro; DIV7). Mouse primary neurons were seeded at a relatively high density of 1.5 × 10⁵/cm2 on DIV0, and transiently transfected with GFP on DIV5. RGB images of GFP-expressing neurons were processed by the Measure Neurites macro at 48 h following transfection. The green channel was extracted from the RGB image and inverted, so the highly fluorescent pixels appear black. The image is manually thresholded such that pixels that exceed the threshold intensity are highlighted in red, while those falling below the threshold remain in greyscale (A). The macro traces the thresholded neurites using the Outlines algorithm (B) and computes the number of neurites measured, average neuritic area, and average neuritic perimeter per image, and the longest neuritic perimeter. Notice that background fluorescence (left side of panel (A) or regions of neurites that are incompletely thresholded due to low fluorescence or uneven illumination (right side of panel A) are not traced by the macro and are thus excluded from the analyses (B). The macro computes average neuritic length by substracting the average soma perimeter from the average total perimeter (soma plus neurites) divided by the number of objects being counted to produce summated neuritic perimeters, which can be divided by 2 to approximate neurite lengths. Alternatively, one can normalize neuritic perimeters or lengths by the number of transfected neurons included in the thresholded image (e.g., GFP neurons containing DAPI stain).
Figure 11.3
Figure 11.3
Features of the GFP-LC3 macro. A representative image of four SH-SY5Y cells transfected with GFP-LC3 and loaded with MitoTracker dye to label mitochondria. Cells were treated with 6-hydroxydopamine for four hours to induce autophagy (A). The cell of interest is traced using the polygonal tracing tool of ImageJ for analysis. The green channel is then extracted from the RGB image and manually thresholded to trace the majority of the somatic GFP-LC3 puncta (colored red within the grey region of interest (B). The macro then traces the thresholded GFP-LC3 puncta by employing the Outlines algorithm (C) and computes the total number of GFP-LC3 puncta analyzed in the field, the average GFP-LC3 puncta size (μm), and percent area occupied by GFP-LC3 puncta. Notice that cytosolic and nuclear GFP-LC3 fluorescence, and background pixelation are not thresholded and are therefore excluded from analysis. (D) Representative neurite of a RA-differentiated SH-SY5Y cell transfected with GFP-LC3. Note that GFP-LC3 puncta are smaller and less numerous than somatic puncta. (E) The GFP-LC3 macro identifies neuritic GFP-LC3 puncta (colored red) for further analysis as described earlier.
Figure 11.4
Figure 11.4
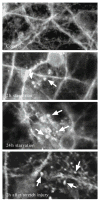
Detecting autophagy in neurons during nutrient deprivation and after dynamic stretch-induced injury in vitro. Primary cortical neurons from GFP-LC3+/transgenic mice were subjected to nutrient deprivation (media without glucose, pyruvate, glutamate, glycine, aspartate, or fatty acids) or dynamic stretch (4.7 psi × 100 ms, ~50% strain). Autophagosomes are identified by discrete, high fluorescent intensity, punctuate labeling (arrows).
Figure 11.5
Figure 11.5
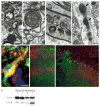
Detecting autophagy after traumatic brain injury (TBI) in vivo. (A and B) Transmission EM from naive mice showing double-membrane structures likely representing neurites in cross section (white arrows). (C and D) Transmission EM from mice 24 h after TBI showing secondary lysosomes and autophagosomes within axons and dendrites (black arrows). (E) Confocal immunohistochemical labeling for LC3 (red), Fluorojade C (green) and DAPI (blue) in a male PND 17 rat 24 h after TBI. Punctate LC3 labeling is shown in a Flurojade-C-positive neuron in the CA3 hippocampus. (F and G) Immunohistochemical labeling for GFP in GFP-LC3+/− mice. Note the loss of green fluorescence but retention of immunolabeling for GFP (red) in the injured region (demarcated by asterisks) from a mouse 24 h after TBI (G) compared to the control (F). (H) Western blot for LC3 in brain tissue. LC3-II is enriched in the P2 subfraction vs. the whole cell lysate (C = control, I = injured).

Similar articles

Cited by

References

    1. Adhami F, Liao G, Morozov YM, Schloemer A, Schmithorst VJ, Lorenz JN, Dunn RS, Vorhees CV, Wills-Karp M, Degen JL, Davis RJ, Mizushima N, et al. Cerebral ischemia-hypoxia induces intravascular coagulation and autophagy. Am J Pathol. 2006;169:566–583. - PMC - PubMed
    1. Anglade P, Vyas S, Javoy-Agid F, Herrero MT, Michel PP, Marquez J, Mouatt-Prigent A, Ruberg M, Hirsch EC, Agid Y. Apoptosis and autophagy in nigral neurons of patients with Parkinson’s disease. Histol Histopathol. 1997;12:25–31. - PubMed
    1. Bilsland J, Roy S, Xanthoudakis S, Nicholson DW, Han Y, Grimm E, Hefti F, Harper SJ. Caspase inhibitors attenuate 1-methyl-4-phenylpyridinium toxicity in primary cultures of mesencephalic dopaminergic neurons. J Neurosci. 2002;22:2637–2649. - PMC - PubMed
    1. Boland B, Nixon RA. Neuronal macroautophagy: From development to degeneration. Mol Aspects Med. 2006;27:503–519. - PubMed
    1. Charych EI, Akum BF, Goldberg JS, Jornsten RJ, Rongo C, Zheng JQ, Firestein BL. Activity-independent regulation of dendrite patterning by post-synaptic density protein PSD-95. J Neurosci. 2006;26:10164–10176. - PMC - PubMed

Publication types

LinkOut - more resources