. 2009 Mar 6;136(5):839-851.
doi: 10.1016/j.cell.2009.01.020. Epub 2009 Feb 12.

Heterozygous deficiency of PHD2 restores tumor oxygenation and inhibits metastasis via endothelial normalization

Affiliations

Heterozygous deficiency of PHD2 restores tumor oxygenation and inhibits metastasis via endothelial normalization

Massimiliano Mazzone et al. Cell. .

Abstract

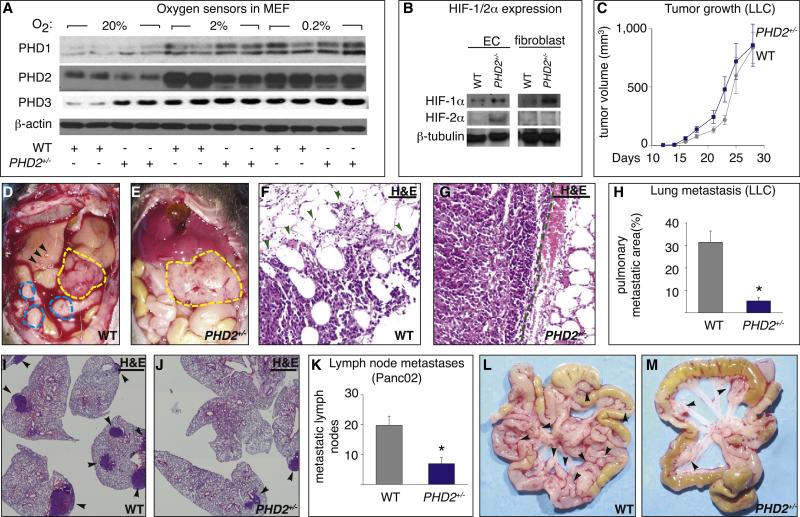
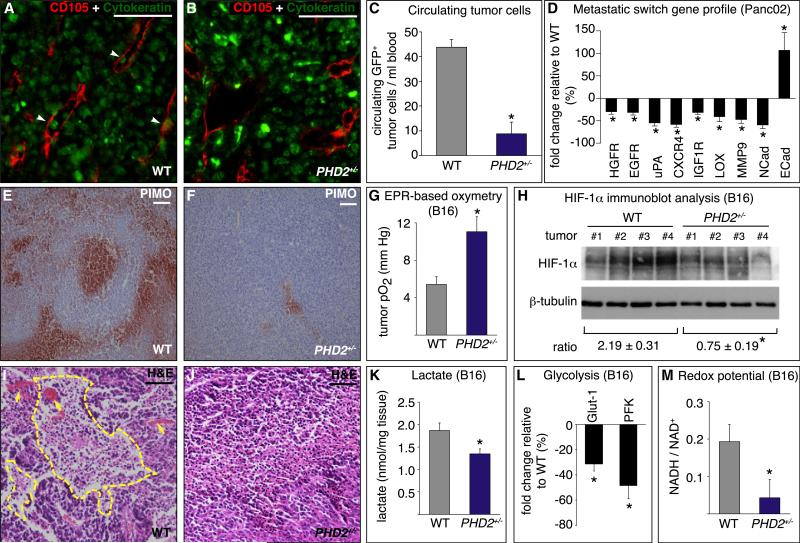
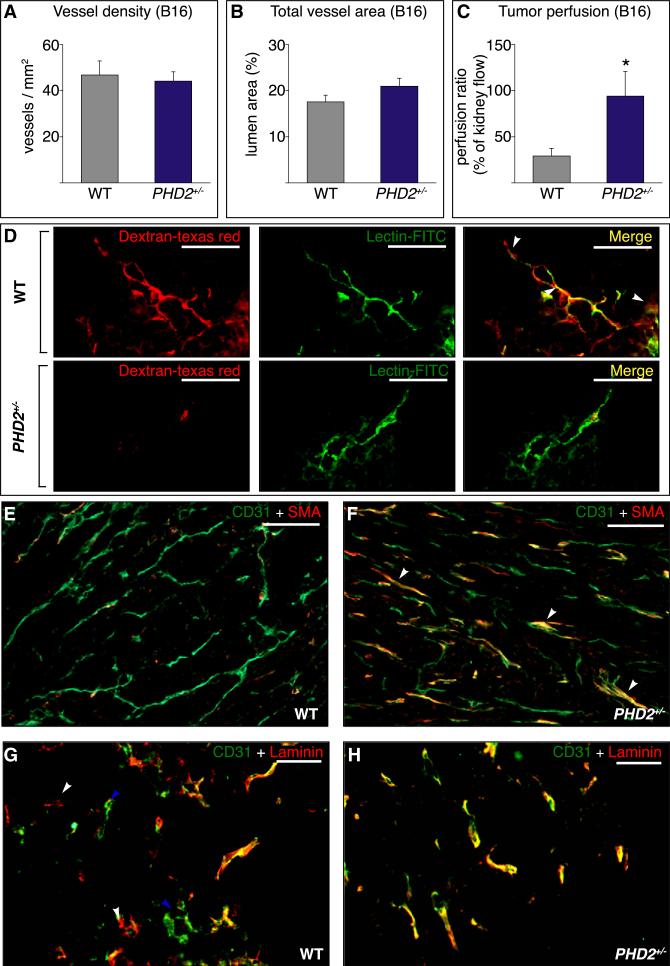
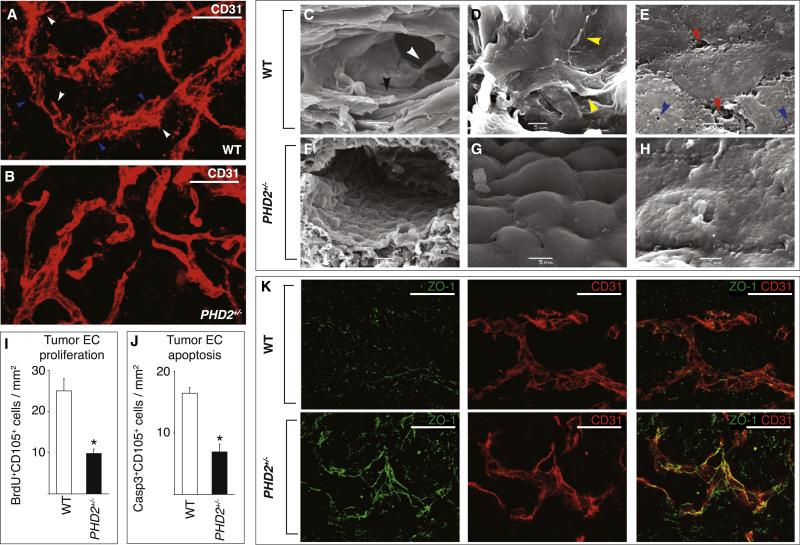
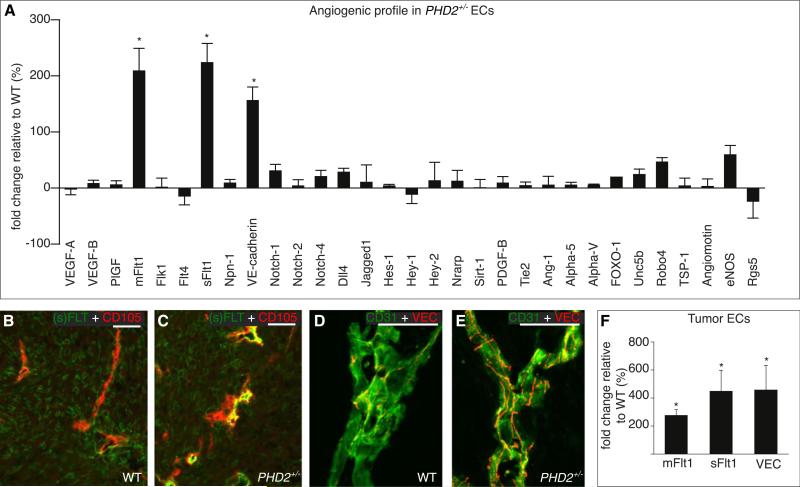
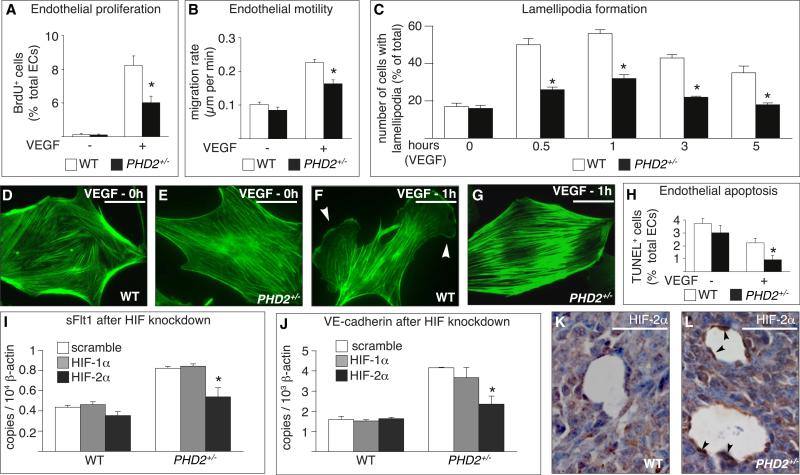
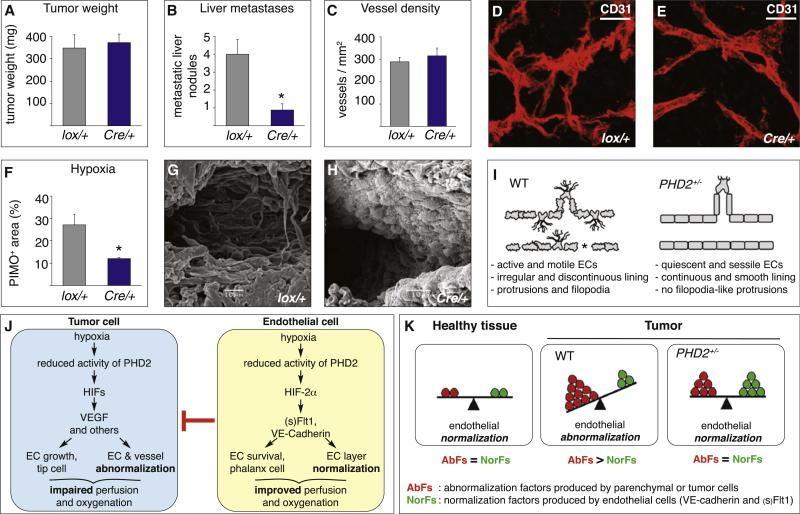
A key function of blood vessels, to supply oxygen, is impaired in tumors because of abnormalities in their endothelial lining. PHD proteins serve as oxygen sensors and may regulate oxygen delivery. We therefore studied the role of endothelial PHD2 in vessel shaping by implanting tumors in PHD2(+/-) mice. Haplodeficiency of PHD2 did not affect tumor vessel density or lumen size, but normalized the endothelial lining and vessel maturation. This resulted in improved tumor perfusion and oxygenation and inhibited tumor cell invasion, intravasation, and metastasis. Haplodeficiency of PHD2 redirected the specification of endothelial tip cells to a more quiescent cell type, lacking filopodia and arrayed in a phalanx formation. This transition relied on HIF-driven upregulation of (soluble) VEGFR-1 and VE-cadherin. Thus, decreased activity of an oxygen sensor in hypoxic conditions prompts endothelial cells to readjust their shape and phenotype to restore oxygen supply. Inhibition of PHD2 may offer alternative therapeutic opportunities for anticancer therapy.


Figures

Figure 1
Figure 1. Reduced Tumor Invasion and Metastasis in PHD2+/− Mice
(A and B) Immunoblot of PHDs in mouse embryonic fibroblasts (MEF) (A) and of HIFs in endothelial cells (EC) and fibroblasts (MEF) (B). (C) Growth of LLC tumors (n = 8; p = 0.33). (D and E) Panc02 tumors (yellow line) are more invasive and metastatic in WT than PHD2+/− mice, as evidenced by hemorrhagic ascites, metastatic nodules (blue line), jaundiced liver, and liver metastases (arrowheads). (F and G) Hematoxylin and eosin (H&E) staining showing infiltrative B16 tumor foci in WT mice ([F]; arrowheads) but encapsulated borders in PHD2+/− mice ([G]; dashed line). (H) Reduced metastasis of LLC tumors in PHD2+/− mice (n = 8; p < 0.0001). (I and J) H&E staining revealing fewer pulmonary metastatic LLC tumor nodules in PHD2+/− mice (arrowheads). (K) Reduced metastasis of Panc02 tumor cells in PHD2+/− mice (n = 27; p = 0.0001). (L and M) Macroscopic view showing more metastatic mesenteric lymph nodes (arrowheads) in WT (L) than PHD2+/− (M) mice. Scale bars represent 50 μm in (F), (G), (I), and (J). Asterisks in (H) and (K) denote statistical significance. Error bars in (C), (H), and (K) show the standard error of the mean (SEM); all subsequent error bars are defined similarly.
Figure 2
Figure 2. Tumor Intravasation and Oxygenation in PHD2+/− Mice
(A and B) Panc02 tumor sections stained for endothelial CD105 (red) and epithelial cytokeratin (green) revealing more intravasated tumor cells (arrowheads) in a WT (A) than PHD2+/− mice (B). (C) Reduced circulating GFP+ tumor cells in PHD2+/− mice (n = 5; p = 0.0005). (D) RT-PCR revealing downregulation of prometastatic genes and upregulation of the anti-metastatic E-cadherin in Panc02 tumors in PHD2+/− mice (percent of WT levels; n = 5–12; p < 0.05). (E and F) Decreased staining for pimonidazole (red) in tumors in PHD2+/− mice. (G) EPR oxymetry revealing increased tumor oxygenation in PHD2+/− mice (n = 10; p = 0.003). (H) Immunoblot for HIF-1α and β-tubulin revealing reduced [HIF-1α/β-tubulin] ratio in tumors in PHD2+/− mice (n = 4; p = 0.007). (I and J) H&E staining showing necrotic area (yellow line) in a tumor of a WT (I) but not PHD2+/− mouse (J). Arrows, blood lakes. (K–M) Reduced Warburg effect in B16 tumors in PHD2+/− mice, shown by reduced lactate content (n = 6; p = 0.04) (K), transcripts of Glut-1 and PFK (percent of WT levels; n = 5; p < 0.05) (L), and [NADH/NAD+] ratio (n = 4; p < 0.05) (M). Scale bars represent 50 μm in (A), (B), (E), (F), (I), and (J). Asterisks in (C), (D), (G), (H), and (K)–(M) denote statistical significance.
Figure 3
Figure 3. Improved Vessel Function and Maturation in PHD2+/− Mice
(A and B) Tumor vessel density (A) and vessel area (B) (n = 6; p = not significant). (C) Improved tumor perfusion in PHD2+/− mice (percent of renal perfusion; n = 10; p = 0.02). (D) Reduced tumor vessel leakiness in PHD2+/− mice upon injection with Texas Red-conjugated dextran (red) and FITC-conjugated lectin (green). White arrowheads on merged images indicate sites of leakage. (E and F) Staining for CD31 (green) and αSMA (red) revealing more pericyte-covered tumor vessels (arrowheads) in PHD2+/− (F) than WT (E) mice. (G and H) Staining for CD31 (green) and laminin (LAM) (red) revealing yellow “mature CD31+ LAM+ vessels,” red “empty CD31 LAM+ sleeves” (white arrowheads), and green “naked CD31+ LAM vessels” (blue arrowheads) in tumors in WT mice (G); tumors in PHD2+/− mice contain primarily yellow “mature CD31+ LAM+ vessels” (H). Scale bars represent 50 μm in (D), (G), and (H) and 100 μm in (E) and (F). The asterisk in (C) denotes statistical significance.
Figure 4
Figure 4. Endothelial Cell Normalization in PHD2+/− Mice
(A and B) Whole-mount staining of thick tumor sections for CD31 (red) revealing similar three-dimensional architecture of tumor vasculature in WT (A) and PHD2+/− (B) mice. The EC lining is discontinuous (blue arrowheads) with ECs protruding in the lumen and perivascular tumor area (white arrowheads), resulting in a hazy, thick appearance of the vessel wall in WT mice (A) but a smooth, continuous, sharply demarcated endothelial lining in PHD2+/− mice (B). (C–H) Scanning electron microscopy of tumor vessels: in WT mice (C–E), vessels are lined by a disorganized, discontinuous, pseudostratified EC layer (black arrowhead in [C]) with ECs crawling over each other (yellow arrowheads in [D]) while forming gaps or being absent in other denuded areas (data not shown); ECs protrude filopodia-like extensions in the lumen (white arrowhead in [C]), possess numerous fenestrations (blue arrowheads in [E]), and fail to form tight cellular junctions but are separated by intercellular gaps (red arrowheads in [E]). By contrast, tumor vessels in PHD2+/− mice (F–H) are lined by a regular, orderly formed, smoothly aligned, tightly apposed, single cobblestone monolayer of “phalanx” ECs (F andG), with few fenestrations and tight intercellular junctions (H). (I) Reduced tumor EC proliferation in PHD2+/− mice (staining for BrdU and CD105; n = 5, p < 0.001). (J) Reduced tumor EC apoptosis in PHD2+/− mice (staining for cleaved caspase-3 and CD105; n = 5, p < 0.001). (K) Confocal microscopy of tumor vessels in whole-mount sections, stained for ZO-1 (green) and CD31 (red), showing long ZO-1+ tight junctions in PHD2+/− ECs but a scattered, discontinuous pattern of short ZO-1+ tight junctions in WT cells. Scale bars represent 25 μm in (A), (B), and (K). Asterisks in (I) and (J) denote statistical significance.
Figure 5
Figure 5. Enhanced (s)Flt1 and VE-Cadherin levels in PHD2+/− Endothelial Cells
(A) RT-PCR analysis of angiogenic genes; bars represent the change in gene expression in PHD2+/− ECs (percent of WT levels; p < 0.01). (B and C) Double staining for CD105 (red) and (s)Flt1 (green) revealing stronger Flt1 signal in tumor vessels in PHD2+/− (C) than WT (B) mice. (D and E) Whole-mount staining for VE-cadherin (red) and CD31 (green) showing more and longer VE-cadherin+ EC junctions in tumor vessels in PHD2+/− (E) than WT (D) mice. (F) RT-PCR analysis revealing elevated levels of mFlt1, sFlt1, and VE-cadherin (VEC) in tumor ECs of PHD2+/− mice (n = 4, p < 0.05). Scale bars represent 50 μm in (B) and (C) and 25 μm in (D) and (E). Asterisks in (A) and (F) denote statistical significance.
Figure 6
Figure 6. In Vitro Characterization of PHD2+/− Endothelial Cells
(A and B) Reduced proliferation (A) and motility (B) of PHD2+/− ECs in response to VEGF (n = 6, p < 0.05). (C) Lamellipodia formation in response to VEGF is impaired in PHD2+/− ECs (n = 100 cells, p < 0.05). (D–G) Phalloidin staining revealing comparable actin cytoskeleton in WT (D) and PHD2+/− (E) ECs in baseline conditions and the formation of lamellipodia (arrowheads) in a WT (F) but not in a PHD2+/− (G) EC upon VEGF stimulation. (H) TUNEL staining revealing reduced apoptosis of starved PHD2+/− ECs in response to VEGF (n = 6; p < 0.02). (I and J) Silencing of HIF-2α inhibits the upregulation of sFlt1 (I) and VE-cadherin (J) expression in normoxic PHD2+/− ECs (n = 3; p < 0.05). (K and L) Staining of HIF-2α revealing stronger immunoreactive signal (arrowheads) in tumor ECs in PHD2+/− (L) than WT (K) mice. Scale bars represent 50 αm in (D) – (G) and 25 αm in (K) and (L). Asterisks in (A)–(C) and (H) denote significance relative to WT; asterisks in (I) and (J) denote significance relative to scramble RNAi.
Figure 7
Figure 7. Phenotypic Characterization of PHD2Cre/+ Mice
(A–H) Phenotype of PHD2Cre/+ mice with endothelial PHD2 haplodeficiency (Cre/+) and PHD2lox/+ (lox/+) control littermates. Panc02 tumor weight (A), vessel density (C), and microvascular architecture (D and E) are comparable, but metastasis (B) and hypoxia (F) are reduced in PHD2Cre/+ mice (n = 10; p < 0.05). Whole-mount CD31 staining and scanning electron microscopy reveal that, in contrast to PHD2lox/+ mice (D and G), the tumor endothelial layer is normalized in PHD2Cre/+ mice (E and H) (see Figures 4F–4H for comparison). (I) Scheme of key EC phenotypes. In abnormalized tumor vessels in WT mice, hypermotile endothelial tip-like cells protrude filopodia in the lumen and perivascular stroma, and abnormally shaped ECs (irregular cell border) form a pseudostratified, loosely attached layer, while other vessel areas become denuded (asterisk). In more normalized tumor vessels in PHD2+/− mice, ECs shift to a phalanx-like phenotype (smooth, regular cell border) characterized by EC survival, tightness, and quiescence, which improves tissue perfusion and oxygen delivery. For reasons of clarity and simplicity, not all phenotypic features (such as for instance, coverage by mural cells) are depicted. (J) PHD2 model. Left: hypoxic tumor cells induce endothelial abnormalization by release of VEGF and other abnormalization factors, which impairs perfusion and causes hypoxia. Right: ECs counteract this abnormalization switch, in part through upregulation of (s)Flt1 and VE-cadherin, thereby improving vessel perfusion and oxygenation. This pathway is more effective in PHD2+/− mice because endothelial PHD2 haplodeficiency resets oxygen sensing and makes them better (pre)-adapted to hypoxia. (K) Scheme of the endothelial abnormalization switch. Left: In healthy tissues, the production of abnormalization factors (AbFs) by (nonendothelial) parenchymal cells is in balance with the production of normalization factors (NorFs) by ECs, resulting in EC normalization. Middle: In tumors in WT mice, excess production of tumor cell-derived AbFs over EC-derived NorFs tilts the balance in favor of EC abnormalization. Right: In tumors in PHD2+/− mice, haplodeficiency of PHD2 up-regulates the production of NorFs by ECs, thereby counteracting EC abnormalization; the resultant improved oxygenation lowers the production of AbFs by tumor cells, overall re-equilibrating the balance in favor of EC normalization. Scale bars represent 50 μm in (F) and (G). Asterisks in (B) and (F) denote statistical significance.

Comment in

References

    1. Baluk P, Hashizume H, McDonald DM. Cellular abnormalities of blood vessels as targets in cancer. Curr. Opin. Genet. Dev. 2005;15:102–111. - PubMed
    1. Bergers G, Hanahan D. Modes of resistance to anti-angiogenic therapy. Nat. Rev. Cancer. 2008;8:592–603. - PMC - PubMed
    1. Carmeliet P, Lampugnani MG, Moons L, Breviario F, Compernolle V, Bono F, Balconi G, Spagnuolo R, Oostuyse B, Dewerchin M, et al. Targeted deficiency or cytosolic truncation of the VE-cadherin gene in mice impairs VEGF-mediated endothelial survival and angiogenesis. Cell. 1999;98:147–157. - PubMed
    1. Couvelard A, Deschamps L, Rebours V, Sauvanet A, Gatter K, Pezzella F, Ruszniewski P, Bedossa P. Overexpression of the oxygen sensors PHD-1, PHD-2, PHD-3, and FIH Is associated with tumor aggressiveness in pancreatic endocrine tumors. Clin. Cancer Res. 2008;14:6634–6639. - PubMed
    1. Dutta D, Ray S, Vivian JL, Paul S. Activation of the VEGFR1 chromatin domain: An angiogenic signal-ETS1/HIF-2alpha regulatory axis. J. Biol. Chem. 2008;283:25404–25413. - PMC - PubMed

Publication types

MeSH terms