. 2009 Feb;16(2):233-44.
doi: 10.1016/j.devcel.2008.12.007.

Cardiac fibroblasts regulate myocardial proliferation through beta1 integrin signaling

Affiliations

Cardiac fibroblasts regulate myocardial proliferation through beta1 integrin signaling

Masaki Ieda et al. Dev Cell. 2009 Feb.

Abstract

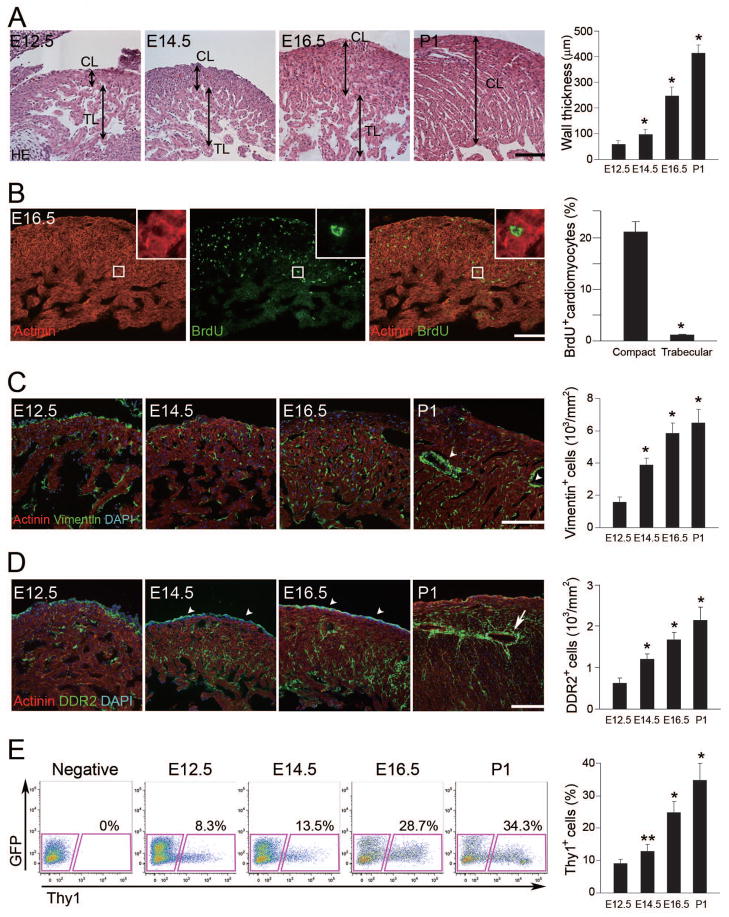
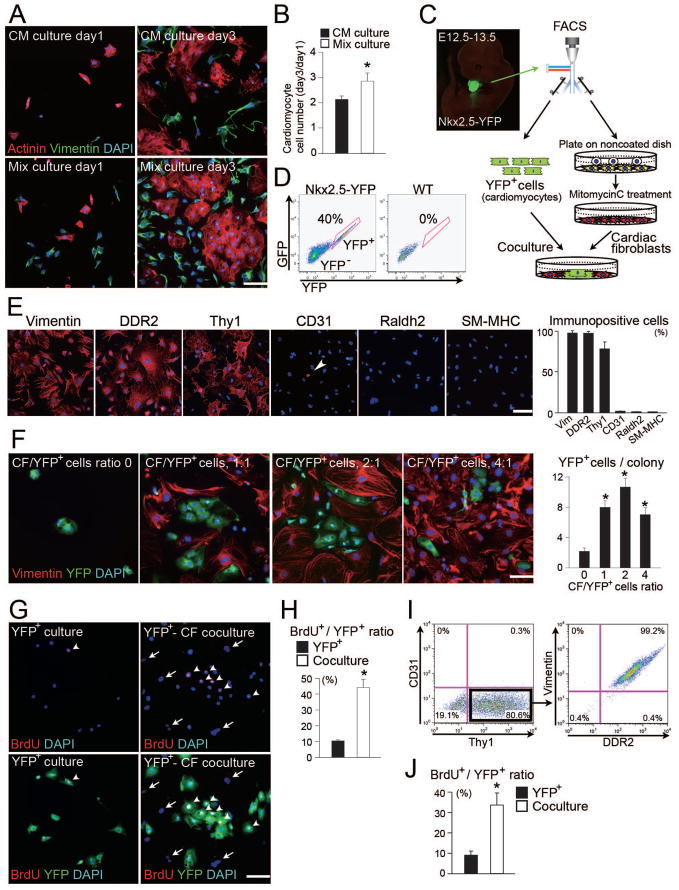
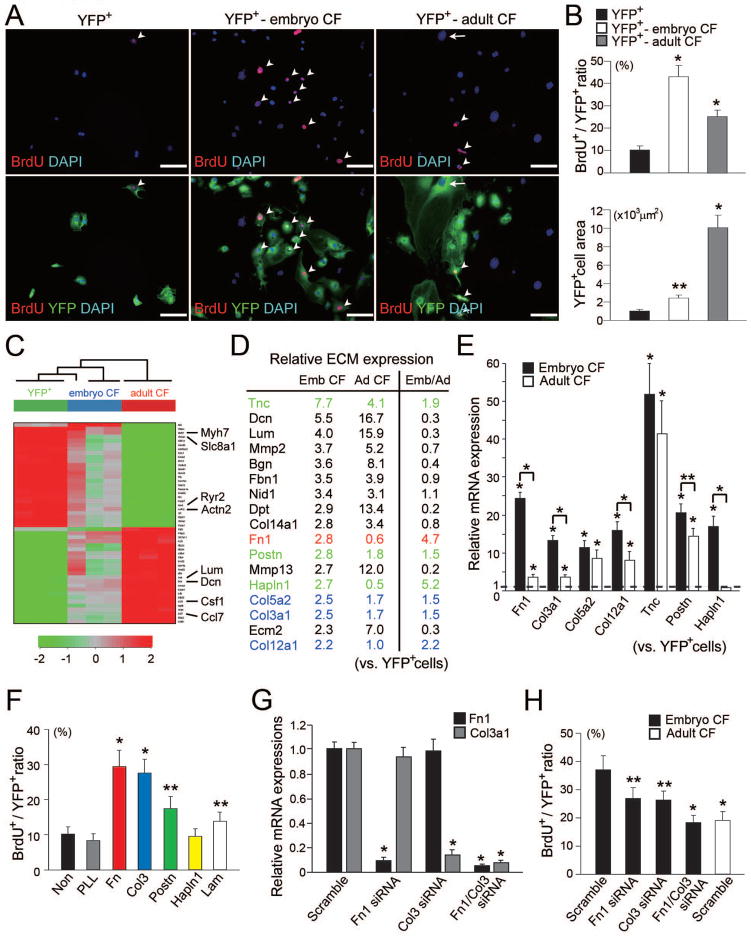
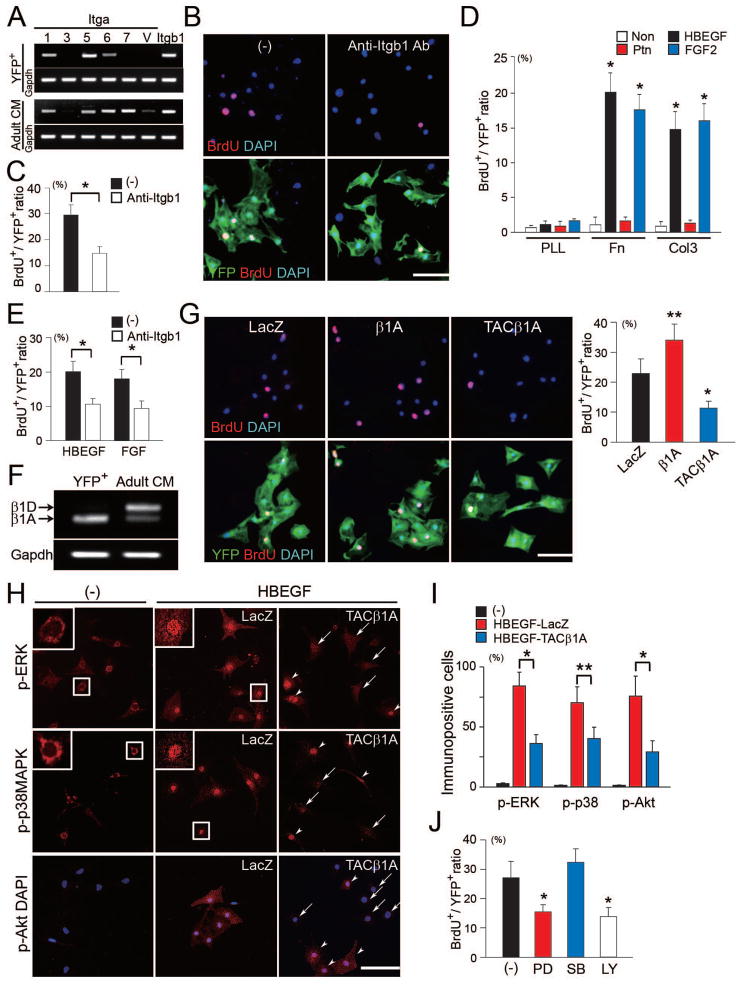
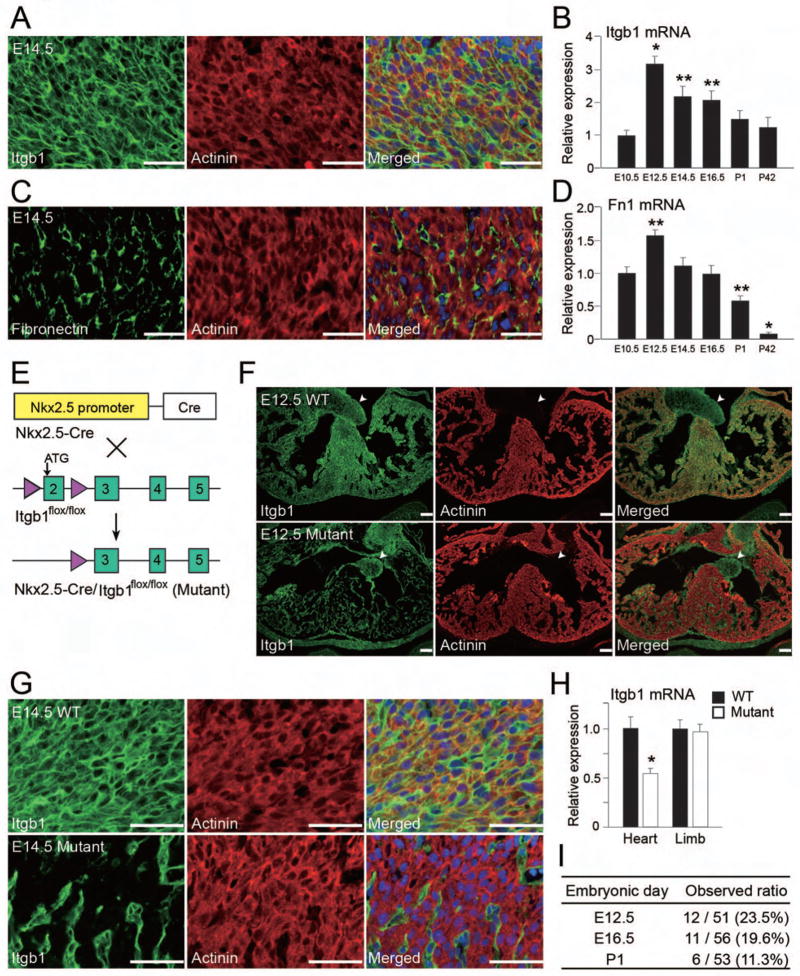
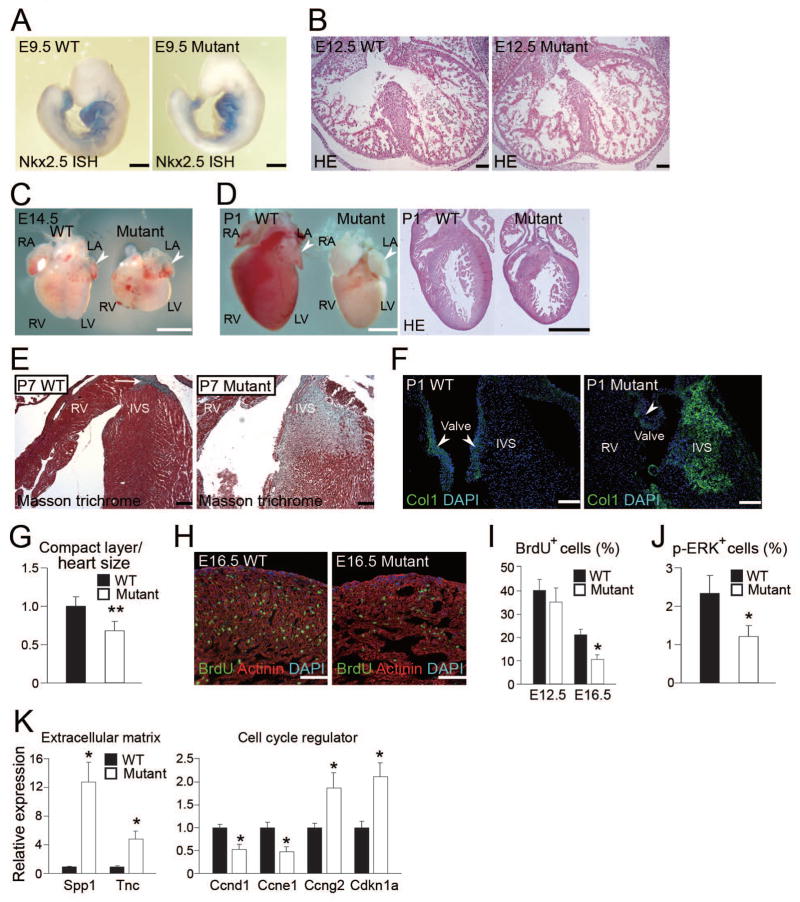
Growth and expansion of ventricular chambers is essential during heart development and is achieved by proliferation of cardiac progenitors. Adult cardiomyocytes, by contrast, achieve growth through hypertrophy rather than hyperplasia. Although epicardial-derived signals may contribute to the proliferative process in myocytes, the factors and cell types responsible for development of the ventricular myocardial thickness are unclear. Using a coculture system, we found that embryonic cardiac fibroblasts induced proliferation of cardiomyocytes, in contrast to adult cardiac fibroblasts that promoted myocyte hypertrophy. We identified fibronectin, collagen, and heparin-binding EGF-like growth factor as embryonic cardiac fibroblast-specific signals that collaboratively promoted cardiomyocyte proliferation in a paracrine fashion. Myocardial beta1-integrin was required for this proliferative response, and ventricular cardiomyocyte-specific deletion of beta1-integrin in mice resulted in reduced myocardial proliferation and impaired ventricular compaction. These findings reveal a previously unrecognized paracrine function of embryonic cardiac fibroblasts in regulating cardiomyocyte proliferation.


Figures

Figure 1
Figure 1. Cardiac Fibroblasts Develop Concordantly with Ventricular Compaction
(A) Sections of left ventricles stained with HE. TL, trabecular layer; CL, compact layer. Quantitative analyses of wall thickness in the compact layer (n = 4). (B) Immunofluorescent staining for actinin (red) and BrdU (green). BrdU+ cells were more abundant in the compact layer than in the trabecular layer. Inset is a high-magnification view. Quantitative analyses were shown (n = 4). (C) Immunofluorescent staining for actinin (red), vimentin (green) and DAPI (blue, nuclei). Vimentin+ cells appeared in the myocardium by E12.5 and gradually increased over time. Note that vimentin+ cells existed around vessels in P1 heart (arrowheads), indicating perivascular fibroblasts. Vimentin+ cell numbers in the left ventricles (n = 4). (D) Development of DDR2+ cells (green) throughout the myocardium. Arrowheads indicate DDR2+ epicardium, and an arrow indicates perivascular fibroblasts. DDR2+ cell numbers in the left ventricles (n = 4). (E) FACS analyses for Thy1+ cells. Thy1+ cells were increased during development (n = 3). Representative data are shown in each panel. All data are presented as means ± SEM. *, P<0.01; **, P<0.05 vs relative control. Scale bars, 100 μm.
Figure 2
Figure 2. Cardiac Fibroblasts Promote Cardiomyocyte Proliferation in Co-culture
(A) Cardiomyocyte-enriched culture (CM culture) and mixed population culture (Mix culture) at days 1 and 3. Immunofluorescent staining for actinin (red), vimentin (green) and DAPI (blue). (B) Increase of actinin+ cell number during a 3-day culture (n = 3). (C) Schematic representation of the co-culture strategy and Nkx2.5-YFP mouse embryo. (D) FACS was used to compare E12.5 Nkx2.5-YFP and wild-type mouse heart cells: 40% of the transgenic heart cells were YFP+. (E) Immunofluorescent staining for vimentin, DDR2, Thy-1, CD31, Raldh2, and SM-MHC in cardiac fibroblast culture. The majority of cells were positive for fibroblast markers (n = 4). (F) YFP+ cells were co-cultured with varying numbers of cardiac fibroblasts. The ratios of cardiac fibroblasts to YFP+ cells varied from 0:1 to 4:1. CF, cardiac fibroblasts. Note that YFP+ cells formed colonies in the co-culture with cardiac fibroblasts. YFP+ cell numbers per colony in the co-cultures (n = 3). (G) Immunofluorescent staining for BrdU (red), YFP (green) and DAPI (blue) in the pure cardiomyocyte culture (YFP+ culture) or the co-culture of cardiomyocytes with fibroblasts (YFP+-CF coculture). Arrowheads indicate BrdU+ cells, and arrows indicate YFP fibroblasts. Note that fibroblasts were all BrdU. (H) Ratios of BrdU+ cells to YFP+ cells indicate the percentage of proliferating cardiomyocytes (n = 5). (I) Thy-1+CD31 cells were FACS sorted from fibroblast culture, and analyzed for vimentin and DDR2 expressions. (J) Ratios of BrdU+ cells to YFP+ cells in the coculture with Thy-1+CD31 cells (n = 3). Representative data are shown in each panel. All data are presented as means ± SEM. *, P < 0.01 vs relative control. Scale bars, 100 μm.
Figure 3
Figure 3. Embryonic Cardiac Fibroblasts Promote Cardiomyocyte Proliferation through Fibronectin and Collagen Synthesis
(A) Immunofluorescent staining for BrdU (red), YFP (green) and DAPI (blue) in the pure cardiomyocyte culture (YFP+), and co-cultures of cardiomyocytes with embryonic (YFP+-embryo CF) or adult cardiac fibroblasts (YFP+-adult CF). Arrowheads indicate BrdU+ cells, and arrow indicates a hypertrophied cardiomyocyte. YFP cells are fibroblasts. (B) Ratios of BrdU+ cells to YFP+ cells (upper panel) and the YFP+ cell areas (lower panel) (n = 4). (C) The heatmap image of hierarchical clustering based on the most variable genes among Nkx-YFP+ cells, embryonic cardiac fibroblasts, and adult cardiac fibroblasts (n = 3 in each group). The scale extends from 0.25- to 4-fold over mean (−2 to +2 in log2 scale) as indicated on the bottom. (D) Profiling of ECM gene expression in embryonic (Emb CF) and adult cardiac fibroblasts (Ad CF). The genes upregulated at least twofold in the embryonic or adult cardiac fibroblasts compared to Nkx-YFP+ cells by microarray analyses are listed with their fold enrichment (n = 3). The ratios of gene expressions in embryonic fibroblasts to those in adult fibroblasts are also shown (Emb/Ad). Fibronectin (red), collagen family (blue) and other ECM genes (green) upregulated in embryonic cardiac fibroblasts are highlighted. (E) qRT-PCR showing enrichment of ECM genes in embryonic cardiac fibroblasts (n = 3). (F) Ratios of BrdU+ cells to YFP+ cells in the pure cardiomyocytes cultured on the different ECMs (n = 4). (G) qRT-PCR confirmed that Fn1 and Col3a1 gene expression was downregulated by Fn1, Col3a1, or both Fn1 and Col3a1 siRNA knockdown (Fn1, Co13, Fn1/Col3 siRNA, respectively) (n = 4). (H) Ratios of BrdU+ cells to YFP+ cells in the co-culture of cardiomyocytes with siRNA-knockdown embryonic and scramble siRNA-treated adult cardiac fibroblasts (n = 4). All data are presented as means ± SEM. *, P<0.01; **, P<0.05 vs relative control. Scale bars, 100 μm.
Figure 4
Figure 4. β1 Integrin Is Required for Cardiomyocyte Proliferation upon Co-culture with Cardiac Fibroblasts
(A) Semiquantitative RT-PCR of integrin α subunits and β1 in embryonic (YFP+) and adult cardiomyocytes (Adult CM). (B) Immunofluorescent staining for BrdU (red), YFP (green) and DAPI (blue) in co-culture of cardiomyocytes with embryonic cardiac fibroblasts on PLL-coated plates. Cells were cultured in the presence of mock (−) or anti-β1 integrin blocking antibody (Anti-Itgb1 Ab). Cell morphology and attachment were not affected in the presence of anti-β1 integrin blocking antibody. (C) Quantitative data of the ratios of BrdU+ cells to YFP+ cells in (B) (n = 5). (D) HBEGF and FGF2 but not Ptn, augmented cardiomyocyte proliferation on fibronectin or collagen III-coated plates (n = 3). (E) BrdU+ cardiomyocytes induced with HBEGF or FGF were reduced by pretreatment with an anti-β1 integrin-blocking antibody (n = 4). (F) Semiquantitative RT-PCR of integrin β1A and D isoforms in embryonic (YFP+) and adult cardiomyocytes (Adult CM). (G) BrdU+ staining in cardiomyocytes treated with HBEGF after modification of β1A integrin signaling by adenoviral infection with control (LacZ), β1A or TACβ1A (n = 5). (H, I) Activation of phospho-ERK1/2 (p-ERK), phospho-p38MAPK (p-p38MAPK) and phospho-Akt (p-Akt) were determined by immunocytochemistry using phospho-specific antibodies (n = 3). Nkx-YFP+ cells were infected with LacZ or TACβ1A adenovirus, and treated with HBEGF. Note that nuclear translocation of p-ERK and p-p38MAPK after HBEGF stimulation, in contrast to perinuclear localization of MAPK before stimulation (insets). Arrowheads indicate activated cells, and arrows indicate non-activated cells. (J) Nkx-YFP+ cells were pretreated with PD98059 (PD), SB203580 (SB) or LY294002 (LY), and stimulated with HBEGF (n = 4). BrdU+ cardiomyocyes were reduced with PD or LY compared with mock treated cells (−). All data are presented as means ± SEM. *, P<0.01; **, P<0.05 vs. relative control. Scale bars, 100 μm.
Figure 5
Figure 5. Generation of Cardiomyocyte-Specific β1 Integrin Knockout Mice
(A) Immunofluorescent staining for β1 integrin (green), α-actinin (red) and DAPI (blue) in E14.5 mouse hearts. Note that a large proportion of β1 integrin+ cells were colabeled with α-actinin. (B) The time course of Itgb1 mRNA expression determined by qRT-PCR (n = 5). (C) Immunofluorescent staining for fibronectin (green), α-actinin (red) and DAPI (blue) in E14.5 mouse hearts. Note that fibronectin and actinin immunoreactivities were not colocalized. (D) The time course of Fn1 mRNA expression determined by qRT-PCR (n = 5). (E) Scheme of the experiments to generate Nkx2.5-Cre/Itgb1flox/flox mice (Mutant) with the Cre-loxP system. (F) Immunofluorescent staining for β1 integrin (green) and actinin (red) in E12.5 wild-type (WT) and mutant hearts. Note that β1 integrin and actinin were colocalized in WT, but not in mutant hearts. Arrowheads indicate valves, immunopositive for β1 integrin in either heart. (G) Immunofluorescent staining for β1 integrin (green), actinin (red) and DAPI in E14.5 wild-type and mutant hearts, exhibited in higher magnification. β1 integrin is specifically deleted in mutant ventricular cardiomyocytes. (H) Itgb1 mRNA expression in wild-type and mutant hearts and limbs, determined by qRT-PCR (n = 4). (I) Ratios of observed mutant mice at different embryonic stages. Absolute numbers are shown with percentages in parenthesis. Note that expected ratio is 25%. Representative data are shown in each panel. All data are presented as means ± SEM. *, P<0.01; **, P<0.05 vs. relative control. Scale bars, 50 μm (A, G); 100 μm (F).
Figure 6
Figure 6. β1 Integrin Is Required for Myocardial Proliferation, Muscle Integrity and Ventricular Chamber Formation in the Compaction Stage
(A) Whole-mount in situ hybridization (ISH) for Nkx2.5 in wild-type and mutant E9.5 embryos. (B) H&E staining of wild type and mutant E12.5 hearts. (C) Wild-type and mutant hearts at E14.5. Mutant ventricles are smaller than wild-type, while atria are same size (arrowheads). RA, right atrium; LA, left atrium; RV, right ventricle; LV, left ventricle. (D) Wild-type and mutant hearts at P1. The right panel shows H&E staining. Note that mutant ventricles were hypoplastic, while the atria were preserved (arrowheads). (E) Masson-trichrome staining in P7 wild-type and mutant hearts. Large amounts of fibrosis were detected in the mutant interventricular septum and right ventricular subendocardium. Arrow indicates His bundle (positive control). (F) Immunofluorescent staining for collagen1 (Col1, green) and DAPI (blue) in the wild-type and mutant P1 hearts. Collagen deposits were observed in mutant hearts. Arrowheads indicate valves (positive control). (G) The ratio of wall thickness in the compact layer to heart size (longest diameter) in wild-type or mutant hearts at P1 (n = 5). (H) Immunofluorescent staining for actinin (red), BrdU (green) and DAPI (blue) in the wild-type and mutant E16.5 left ventricles. BrdU+ cells were reduced in the mutant heart. (I) Percentage of BrdU+ cells in the wild-type and mutant hearts at E12.5 and E16.5. (J) Percentage of p-ERK+ cells in wild-type or mutant hearts at E16.5. (K) qRT-PCR of Spp1 and TnC mRNA (left panel), and Ccnd1, Ccne1, Ccng2, and Cdkn1a mRNA (right panel) in E12.5 wild-type and mutant hearts. Representative data are shown in each panel. All data are presented as means ± SEM. *, P<0.01; **, P<0.05 vs. relative control. Scale bars, 100 μm (B, E, F, H); 500 μm (A); 1 mm (C and D).

Comment in

References

    1. Baudino TA, Carver W, Giles W, Borg TK. Cardiac fibroblasts: friend or foe? Am J Physiol Heart Circ Physiol. 2006;291:H1015–1026. - PubMed
    1. Cai CL, Martin JC, Sun Y, Cui L, Wang L, Ouyang K, Yang L, Bu L, Liang X, Zhang X, et al. A myocardial lineage derives from Tbx18 epicardial cells. Nature. 2008;454:104–108. - PMC - PubMed
    1. Camelliti P, Borg TK, Kohl P. Structural and functional characterisation of cardiac fibroblasts. Cardiovasc Res. 2005;65:40–51. - PubMed
    1. Demayo F, Minoo P, Plopper CG, Schuger L, Shannon J, Torday JS. Mesenchymal-epithelial interactions in lung development and repair: are modeling and remodeling the same process? Am J Physiol Lung Cell Mol Physiol. 2002;283:L510–517. - PubMed
    1. Dettman RW, Denetclaw W, Jr, Ordahl CP, Bristow J. Common epicardial origin of coronary vascular smooth muscle, perivascular fibroblasts, and intermyocardial fibroblasts in the avian heart. Dev Biol. 1998;193:169–181. - PubMed

Publication types

Associated data