

Peptide adsorption to lipid bilayers: slow processes revealed by linear dichroism spectroscopy
- PMID: 19217857
- PMCID: PMC2717241
- DOI: 10.1016/j.bpj.2008.10.039
Peptide adsorption to lipid bilayers: slow processes revealed by linear dichroism spectroscopy
Abstract
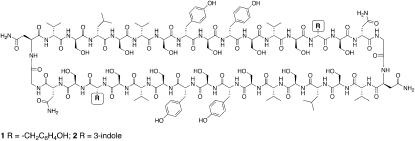
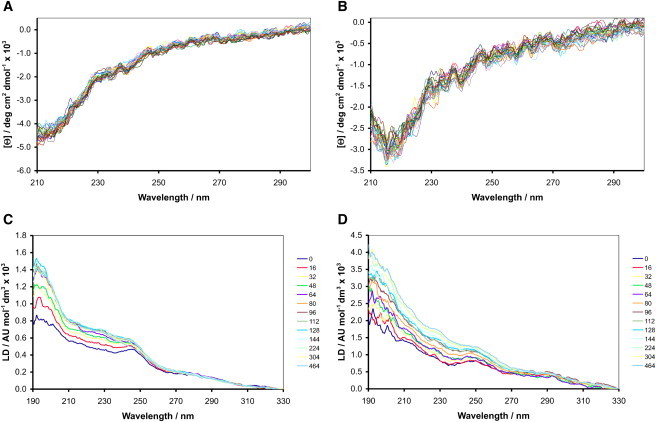
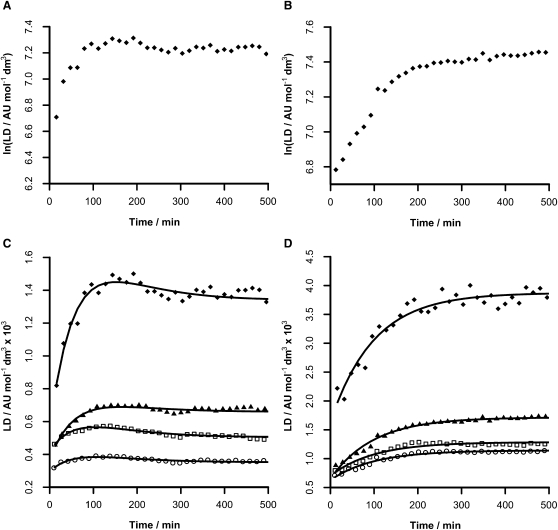
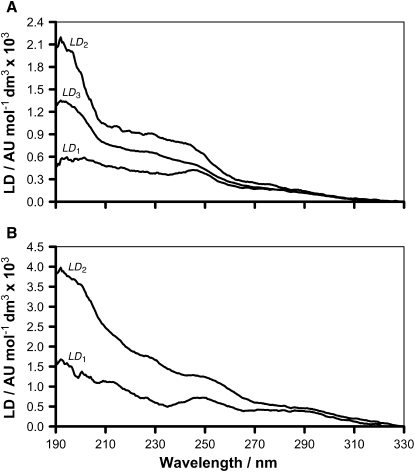
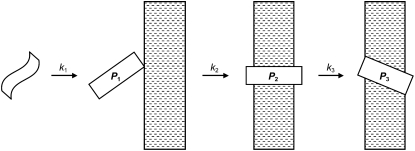
The adsorption and insertion kinetics for the association of two 34-residue cyclic peptides with phosphocholine membranes have been studied using circular and linear dichroism approaches. The two peptides studied are identical with the exception of two residues, which are both tyrosine in one of the peptides and tryptophan in the other. Both peptides adopt random coil conformations in solution in the absence of membranes and do not aggregate at concentrations below 20 microM. After addition to liposome dispersions, circular dichroism spectroscopy indicated that both peptides undergo an extremely rapid transformation to a beta-conformation that remains unchanged throughout the remainder of the experiment. Linear dichroism (LD) spectroscopy was used to study the kinetics of membrane adsorption and insertion. The data were analyzed by nonlinear least squares approaches, leading to identification of a number of bound states and their corresponding LD spectra. Two pseudo-first order processes could be identified that were common to both peptides. The first occurred with a time constant of the order of 1 min and led to a bound state characterized by weak LD signals, with significant bands corresponding to the transitions of aromatic side chains. The second process occurred with an unusually long time constant of between 75 and 100 min, forming a state with considerably stronger positive LD absorbance in the far-ultraviolet region of the spectrum. For the tyrosine-substituted peptide, a third slow process with a long time constant (76 min) could also be delineated and was attributed to rearrangements of the peptide within the membrane.
Figures


Similar articles
-
Conformations and orientations of aromatic amino acid residues of tachyplesin I in phospholipid membranes.Biochemistry. 1997 Apr 8;36(14):4352-9. doi: 10.1021/bi962171f. Biochemistry. 1997. PMID: 9100032
-
Tryptophan orientations in membrane-bound gramicidin and melittin-a comparative linear dichroism study on transmembrane and surface-bound peptides.Biochim Biophys Acta. 2011 Jan;1808(1):219-28. doi: 10.1016/j.bbamem.2010.10.004. Epub 2010 Oct 15. Biochim Biophys Acta. 2011. PMID: 20951675
-
Influence of proline residues on the antibacterial and synergistic activities of alpha-helical peptides.Biochemistry. 1999 Jun 22;38(25):8102-11. doi: 10.1021/bi9904104. Biochemistry. 1999. PMID: 10387056
-
Spectroscopy of model-membrane liposome-protein systems: complementarity of linear dichroism, circular dichroism, fluorescence and SERS.Emerg Top Life Sci. 2021 May 14;5(1):61-75. doi: 10.1042/ETLS20200354. Emerg Top Life Sci. 2021. PMID: 33942863 Review.
-
Light scattering corrections to linear dichroism spectroscopy for liposomes in shear flow using calcein fluorescence and modified Rayleigh-Gans-Debye-Mie scattering.Biophys Rev. 2018 Oct;10(5):1385-1399. doi: 10.1007/s12551-018-0458-8. Epub 2018 Sep 25. Biophys Rev. 2018. PMID: 30255222 Free PMC article. Review.
Cited by
-
Latest developments on the mechanism of action of membrane disrupting peptides.Biophys Rep. 2021 Jun 30;7(3):173-184. doi: 10.52601/bpr.2021.200037. Biophys Rep. 2021. PMID: 37287489 Free PMC article.
-
On the origin of multiphasic kinetics in peptide binding to phospholipid vesicles.J Phys Chem B. 2012 Jan 26;116(3):951-7. doi: 10.1021/jp209080m. Epub 2012 Jan 13. J Phys Chem B. 2012. PMID: 22242648 Free PMC article.
-
Is DNA a worm-like chain in Couette flow? In search of persistence length, a critical review.Sci Prog. 2009;92(Pt 2):163-204. doi: 10.3184/003685009X462205. Sci Prog. 2009. PMID: 19697713 Free PMC article. Review.
-
Spectroscopic and Microscopic Approaches for Investigating the Dynamic Interactions of Anti-microbial Peptides With Membranes and Cells.Front Med Technol. 2021 Jan 21;2:628552. doi: 10.3389/fmedt.2020.628552. eCollection 2020. Front Med Technol. 2021. PMID: 35047900 Free PMC article. Review.
References
-
- Ulmschneider M.B., Sansom M.S. Amino acid distributions in integral membrane protein structures. Biochim. Biophys. Acta. 2001;1512:1–14. - PubMed
-
- Landolt-Marticorena C., Williams K.A., Deber C.M., Reithmeier R.A. Non-random distribution of amino acids in the transmembrane segments of human type I single span membrane proteins. J. Mol. Biol. 1993;229:602–608. - PubMed
-
- Sanderson J.M. Peptide-lipid interactions: insights and perspectives. Org. Biomol. Chem. 2005;3:201–212. - PubMed
-
- Sanderson J.M., Whelan E.J. Characterization of the interactions of aromatic amino acids with diacetyl phosphatidylcholine. Phys. Chem. Chem. Phys. 2004;6:1012–1017.
Publication types
MeSH terms
Substances
LinkOut - more resources
Full Text Sources
Research Materials
