

Mitotic chromosome structure: reproducibility of folding and symmetry between sister chromatids
- PMID: 19217877
- PMCID: PMC2717231
- DOI: 10.1016/j.bpj.2008.10.051
Mitotic chromosome structure: reproducibility of folding and symmetry between sister chromatids
Abstract
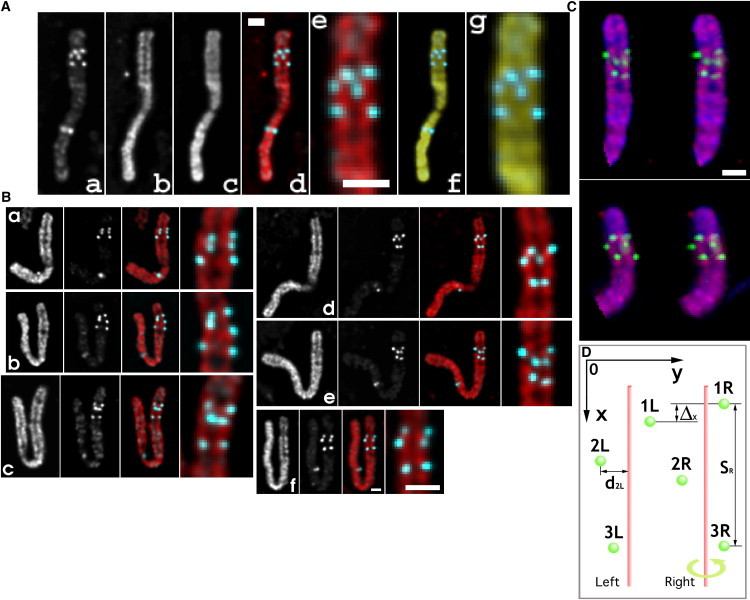
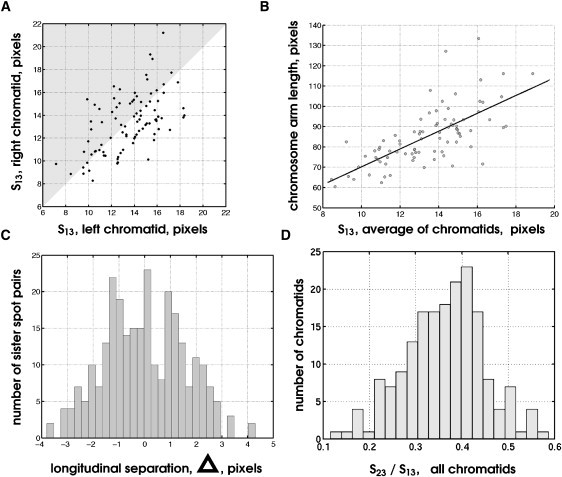
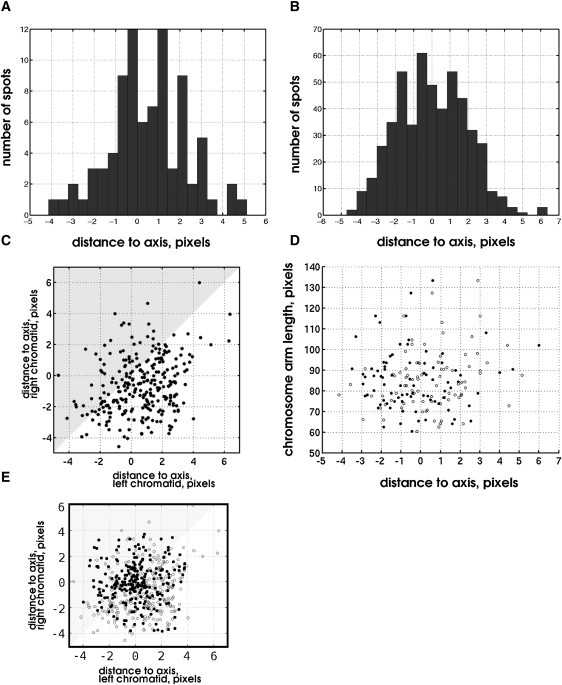
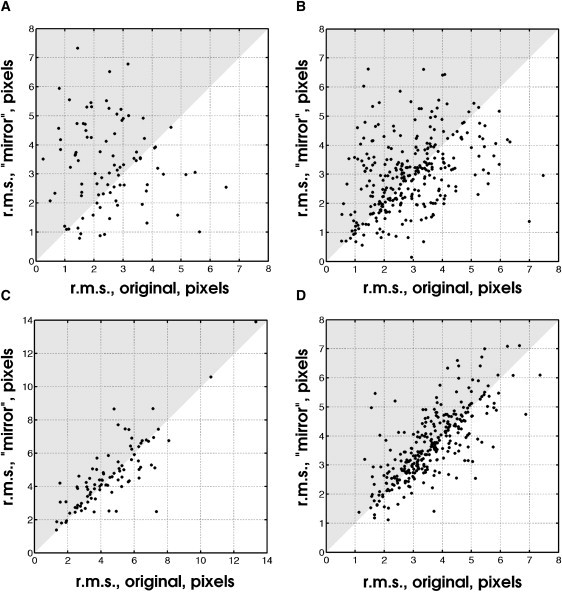
Mitotic chromosome structure and pathways of mitotic condensation remain unknown. The limited amount of structural data on mitotic chromosome structure makes it impossible to distinguish between several mutually conflicting models. Here we used a Chinese hamster ovary cell line with three different lac operator-tagged vector insertions distributed over an approximately 1 microm chromosome arm region to determine positioning reproducibility, long-range correlation in large-scale chromatin folding, and sister chromatid symmetry in minimally perturbed, metaphase chromosomes. The three-dimensional positions of these lac operator-tagged spots, stained with lac repressor, were measured in isolated metaphase chromosomes relative to the central chromatid axes labeled with antibodies to topoisomerase II. Longitudinal, but not axial, positioning of spots was reproducible but showed intrinsic variability, up to approximately 300 nm, between sister chromatids. Spot positions on the same chromatid were uncorrelated, and no correlation or symmetry between the positions of corresponding spots on sister chromatids was detectable, showing the absence of highly ordered, long-range chromatin folding over tens of mega-basepairs. Our observations are in agreement with the absence of any regular, reproducible helical, last level of chromosome folding, but remain consistent with any hierarchical folding model in which irregularity in folding exists at one or multiple levels.
Figures

Similar articles
-
Visualization of early chromosome condensation: a hierarchical folding, axial glue model of chromosome structure.J Cell Biol. 2004 Sep 13;166(6):775-85. doi: 10.1083/jcb.200406049. Epub 2004 Sep 7. J Cell Biol. 2004. PMID: 15353545 Free PMC article.
-
Engineered chromosome regions with altered sequence composition demonstrate hierarchical large-scale folding within metaphase chromosomes.J Cell Biol. 2003 Jul 7;162(1):23-35. doi: 10.1083/jcb.200303098. Epub 2003 Jun 30. J Cell Biol. 2003. PMID: 12835314 Free PMC article.
-
The metaphase scaffold is helically folded: sister chromatids have predominantly opposite helical handedness.Cell. 1988 Dec 23;55(6):937-44. doi: 10.1016/0092-8674(88)90239-5. Cell. 1988. PMID: 2849511
-
The making of the mitotic chromosome: modern insights into classical questions.Mol Cell. 2003 Mar;11(3):557-69. doi: 10.1016/s1097-2765(03)00103-5. Mol Cell. 2003. PMID: 12667441 Review.
-
Sister chromatid separation in vivo and in vitro.Curr Opin Genet Dev. 1995 Apr;5(2):243-8. doi: 10.1016/0959-437x(95)80015-8. Curr Opin Genet Dev. 1995. PMID: 7613095 Review.
Cited by
-
Quantitative analysis of chromatin compaction in living cells using FLIM-FRET.J Cell Biol. 2009 Nov 16;187(4):481-96. doi: 10.1083/jcb.200907029. J Cell Biol. 2009. PMID: 19948497 Free PMC article.
-
Novel insights into mitotic chromosome condensation.F1000Res. 2016 Jul 25;5:F1000 Faculty Rev-1807. doi: 10.12688/f1000research.8727.1. eCollection 2016. F1000Res. 2016. PMID: 27508072 Free PMC article. Review.
-
New insights into nucleosome and chromatin structure: an ordered state or a disordered affair?Nat Rev Mol Cell Biol. 2012 Jun 22;13(7):436-47. doi: 10.1038/nrm3382. Nat Rev Mol Cell Biol. 2012. PMID: 22722606 Free PMC article. Review.
-
Imaging Specific Genomic DNA in Living Cells.Annu Rev Biophys. 2016 Jul 5;45:1-23. doi: 10.1146/annurev-biophys-062215-010830. Epub 2016 Apr 27. Annu Rev Biophys. 2016. PMID: 27145877 Free PMC article. Review.
-
Chromosomes without a 30-nm chromatin fiber.Nucleus. 2012 Sep-Oct;3(5):404-10. doi: 10.4161/nucl.21222. Epub 2012 Jul 31. Nucleus. 2012. PMID: 22825571 Free PMC article.
References
-
- Gassmann R., Vagnarelli P., Hudson D., Earnshaw W.C. Mitotic chromosome formation and the condensin paradox. Exp. Cell Res. 2004;296:35–42. - PubMed
-
- Swedlow J.R., Hirano T. The making of the mitotic chromosome: modern insights into classical questions. Mol. Cell. 2003;11:557–569. - PubMed
-
- Marsden M.P., Laemmli U.K. Metaphase chromosome structure: evidence for a radial loop model. Cell. 1979;17:849–858. - PubMed
-
- Paulson J.R., Laemmli U.K. The structure of histone-depleted metaphase chromosomes. Cell. 1977;12:817–828. - PubMed
Publication types
MeSH terms
Substances
Grants and funding
LinkOut - more resources
Full Text Sources
