Review
. 2009 Feb;15(1):62-77.
doi: 10.1177/1073858408327806.

Ocular dominance columns: enigmas and challenges

Affiliations
Review

Ocular dominance columns: enigmas and challenges

Daniel L Adams et al. Neuroscientist. 2009 Feb.

Abstract

In some mammalian species, geniculocortical afferents serving each eye are segregated in layer 4C of striate cortex into stripes called ocular dominance columns. Having described the complete pattern of ocular dominance columns in the human brain, the authors enumerate here the principal enigmas that confront future investigators. Probably the overarching challenge is to explain the function, if any, of ocular dominance columns and why they are present in some species and not others. A satisfactory solution must account for the enormous natural variation, even within the same species, among individuals in column expression, pattern, periodicity, and alignment with other components of the functional architecture. Another major priority is to explain the development of ocular dominance columns. It has been established clearly that they form without visual experience, but the innate signals that guide their segregation and maturation are unknown. Experiments addressing the role of spontaneous retinal activity have yielded contradictory data. These studies must be reconciled, to pave the way for new insights into how columnar structure is generated in the cerebral cortex.


Figures
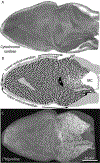
Figure 1.
Figure 1.
Ocular dominance columns in a normal macaque monkey. A, Montage of layer 4C, prepared from a V1 flatmount after enucleation of the right eye and processing of the tissue for cytochrome oxidase (CO) activity, revealing the pattern of ocular dominance columns. B, Digital representation of the data in (A), showing the left (black) and the right (white) ocular dominance columns, along with approximate retinotopic coordinates. Columns are present everywhere, except in the representation of the monocular crescent (MC) and the blind spot (*). Between these two landmarks, the ipsilateral columns become progressively more diminutive. Gray regions denote two sulci where the column pattern was obscured. C, Autoradiograph prepared from alternate sections after injection of [3H]proline into the remaining left eye. The perfect match between A and C proves that CO can be used as a substitute for autoradiography to label the ocular dominance columns (Sincich and Horton 2002a).
Figure 2.
Figure 2.
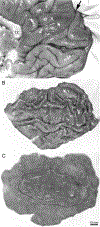
Preparation of flatmounts from the human occipital lobe. A, Intact right occipital lobe after removal of the leptomeninges, showing the medial face. The dashed line indicates the V1/V2 border, where it is present on the surface of the brain. Arrow = parieto-occipital sulcus; CC = corpus callosum; CS = calcarine sulcus. B, Midway through the dissection, showing the opened calcarine sulcus. The numbers denote corresponding locations in each image. C, Final flattened tissue block, ready to be frozen and cut with a microtome. The location of V1, determined later from cytochrome oxidase–stained sections, is shown by the dashed line. The surface area of the flatmount is 9413 mm2. Reprinted from Adams and others (2007) with permission from the Society for Neuroscience.
Figure 3.
Figure 3.
Ocular dominance columns in the human brain. Computer montages of layer 4C processed for cytochrome oxidase (CO) activity in a patient who became blind in the left eye about a year before death show the complete pattern of ocular dominance columns in striate cortex. The digital versions of the columns shown below were prepared by high-pass Fourier filtering of CO data followed by application of a threshold. The dotted line denotes the V2/V3 border. In area V2, alternating dark and light CO stripes are visible, but dark stripes cannot be classified as thick and thin. The process of flattening this right striate cortex is shown in Figure 2. Reprinted from Adams and others (2007) with permission from the Society for Neuroscience.
Figure 4.
Figure 4.
The retinotopic map and ocular dominance column pattern in the human striate cortex. The medial face of the right hemisphere is depicted, with the calcarine sulcus opened to expose the striate cortex. Visual eccentricity is color-coded: The representation of the fovea is red and the far periphery is violet. CC = corpus callosum; POS = parieto-occipital sulcus. The visual field map is shown on a flattened specimen, with the retinotopic coordinates derived from Horton and Hoyt (1991). In this case, the ocular dominance columns were labeled by cytochrome oxidase staining, as shown in Figure 3. Projection of the striate cortex back onto the visual hemifield demonstrates the enormous magnification of central vision in the cortex. The central 16° are shown at higher magnification at the lower right. Because ocular dominance columns are relatively constant in size, their projection onto the visual field is greatly distorted by cortical magnification.
Figure 5.
Figure 5.
Human ocular dominance columns obtained using Hahn spin echo BOLD fMRI at 7 tesla. The image depicts a 3 mm thick slice through a flat portion of the cortex on the lower bank of the calcarine sulcus. Differential increases in activity following left eye stimulation (blue) and right eye stimulation (red) with a flickering checkerboard were imaged on two consecutive days and the maps registered. Arrows indicate the locations of left (cyan) and right (yellow) ocular dominance columns. Reprinted from Yacoub and others (2007) with permission from Elsevier.
Figure 6.
Figure 6.
Ocular dominance columns in the right striate cortex of three different macaques. The columns were visualized by cytochrome oxidase staining after enucleation of the right eye in adulthood. Note the twofold variation in column periodicity among normal individuals from the same species. Reprinted from Horton and Hocking (1996c) with permission from the Society for Neuroscience.
Figure 7.
Figure 7.
Comparison of human and macaque. Ocular dominance columns in the human after loss of the right eye, prepared by montaging cytochrome oxidase sections from layer 4C in the right V1. A thresholded version of the columns is shown below. For comparison, a typical column pattern from the macaque is shown (Horton and Hocking 1996c, their Fig. 3; reprinted with permission from the Society for Neuroscience.). The macaque pattern has been enlarged to equal the size of the human V1 illustrated above. These examples were chosen because the human and macaque patterns are quite similar; in general, columns in humans exhibit greater heterogeneity in periodicity and appearance. Reprinted from Adams and others (2007) with permission from the Society for Neuroscience.
Figure 8.
Figure 8.
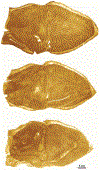
Capricious expression of ocular dominance columns in squirrel monkeys. For comparison, cytochrome oxidase (CO) montages of layer 4C from the left striate cortex of two squirrel monkeys are shown, after enucleation of the left eye. The case on the left shows large, crisply segregated columns, in stark contrast to the near absence of columns in the case on the right. The presence of the blind spot and angioscotoma representations on the right proves that the CO staining worked properly, that is, where monocular regions exist, they are visible. Reprinted from Adams and Horton (2003a) with permission from Nature Publishing Group.
Figure 9.
Figure 9.
Mirror symmetry of column patterns. Left and right hemispheres from a squirrel monkey after removal of the left eye; the columns are well segregated in the peripheral cortex but dissipate in the central visual field (0°−5°), except in the foveal representation (asterisk). Note the symmetry between the left and right hemispheres in the column patterns, although they are not identical. MC = monocular crescent. Reprinted from Adams and Horton (2003a) with permission from Nature Publishing Group.
Figure 10.
Figure 10.
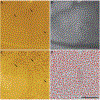
Macaque: Alignment of ocular dominance columns and patches. A, Autoradiograph of layer 4C, showing brightly labeled ocular dominance columns after monocular [3H]proline eye injection. B, Cytochrome oxidase patches from the same region in layer 2/3. Arrows indicate blood vessels used to align the two images. C, The center of each patch is represented by a red dot and superimposed on a thresholded version of the column pattern. There is an obvious tendency for patches to align with column centers. Scale bar 5 mm.
Figure 11.
Figure 11.
Squirrel monkey: Misalignment of ocular dominance columns and patches. A, Cytochrome oxidase patches from the upper layers of the squirrel monkey striate cortex. B, Autoradiograph of an adjacent section following [3H]proline injection into the right eye. In contrast to the macaque, in which only alternate rows of patches are labeled, here every patch contains [3H]proline. C, Layer 4C from the same region of striate cortex, showing the ocular dominance columns. Arrows denote blood vessels used to align the patches and columns. D, Patch centers are shown as red dots, overlying the thresholded ocular dominance column pattern. Unlike the situation in the macaque (Fig. 10), there is no relationship between patches and columns. Scale bar 5 mm.
Figure 12.
Figure 12.
Shadows cast by retinal blood vessels are represented in the striate cortex. A, Retina of a normal squirrel monkey. B, Cytochrome oxidase (CO) staining after enucleation of the right eye reveals fine ocular dominance columns and blood vessel representations. Most angioscotomas are dark, because they represent vessels of the right eye’s nasal retina, but a few are pale, representing the left eye’s temporal retina. C, Drawing of the right fundus. Star = right fovea. The dotted lines denote the left eye’s blind spot and major inferior fundus vessels (see left eye retinal, inset). Their temporal segments account for the two pale angioscotoma representations visible in the lower left cortex. D, Drawing of CO pattern, color-matching retinal and cortical features. MC = monocular crescent; BS =blind spot. Reprinted from Adams and Horton (2002) with permission from the American Association for the Advancement of Science.
Figure 13.
Figure 13.
Macaque column shrinkage. Autoradiographic montages of layer 4Cβ in an adult macaque raised from age eight days with right eyelid suture. The right eye was injected with [3H]proline to label the deprived columns (bright regions). They appear eroded, as if the open eye has worn away their surface by the same amount everywhere. Note the contrasting appearance of the deprived columns between the optic disc and monocular crescent in the two hemispheres. Their shrinkage seems greater in the right cortex, only because ipsilateral columns are small and fragmented in this region in normal monkeys (see Fig. 1). Surprisingly, the left eye’s blind spot representation (inset) appears moth-eaten, although the deprived right eye’s afferents should be at no competitive disadvantage in this region.
Figure 14.
Figure 14.
Cat column shrinkage. A, Autoradiographic montage of layer 4, left V1 in a cat raised from age eight days with left eyelid suture, after left eye proline injection. The deprived columns are modestly shrunken. The remarkable finding is that the deprived eye’s afferents formed into columns at all, considering that none were present when deprivation was initiated. B, Montage from another cat deprived at age eight days, prepared this time after injection of proline into the open, right eye. Arrow shows regions where the open eye has ceded territory to the deprived eye, despite its competitive advantage. Reprinted from Schmidt and others (2002) with permission from Oxford University Press.

References

    1. Adams DL, Horton JC. 2002. Shadows cast by retinal blood vessels mapped in primary visual cortex. Science 298:572–6. - PMC - PubMed
    1. Adams DL, Horton JC. 2003a. Capricious expression of cortical columns in the primate brain. Nat Neurosci 6:113–14. - PubMed
    1. Adams DL, Horton JC. 2003b. The representation of retinal blood vessels in primate striate cortex. J Neurosci 23:5984–97. - PMC - PubMed
    1. Adams DL, Horton JC. 2006a. Monocular cells without ocular dominance columns. J Neurophysiol 96:2253–64. - PubMed
    1. Adams DL, Horton JC. 2006b. Ocular dominance columns in strabismus. Vis Neurosci 23:795–805. - PubMed

LinkOut - more resources