. 2009 Apr;149(4):1970-81.
doi: 10.1104/pp.108.134932. Epub 2009 Feb 13.

Engineered polyamine catabolism preinduces tolerance of tobacco to bacteria and oomycetes

Affiliations

Engineered polyamine catabolism preinduces tolerance of tobacco to bacteria and oomycetes

Panagiotis N Moschou et al. Plant Physiol. 2009 Apr.

Abstract

Polyamine oxidase (PAO) catalyzes the oxidative catabolism of spermidine and spermine, generating hydrogen peroxide. In wild-type tobacco (Nicotiana tabacum 'Xanthi') plants, infection by the compatible pathogen Pseudomonas syringae pv tabaci resulted in increased PAO gene and corresponding PAO enzyme activities; polyamine homeostasis was maintained by induction of the arginine decarboxylase pathway and spermine was excreted into the apoplast, where it was oxidized by the enhanced apoplastic PAO, resulting in higher hydrogen peroxide accumulation. Moreover, plants overexpressing PAO showed preinduced disease tolerance against the biotrophic bacterium P. syringae pv tabaci and the hemibiotrophic oomycete Phytophthora parasitica var nicotianae but not against the Cucumber mosaic virus. Furthermore, in transgenic PAO-overexpressing plants, systemic acquired resistance marker genes as well as a pronounced increase in the cell wall-based defense were found before inoculation. These results reveal that PAO is a nodal point in a specific apoplast-localized plant-pathogen interaction, which also signals parallel defense responses, thus preventing pathogen colonization. This strategy presents a novel approach for producing transgenic plants resistant to a broad spectrum of plant pathogens.


Figures

Figure 1.
Figure 1.
Abundance of NtPAO mRNA levels, PAO protein, and specific activity in wild-type plants treated with PS. A, RT-PCR analysis for the NtPAO mRNA expression level at 12 hpi. Samples were standardized using the NtUbi gene in wild-type plants treated with PS, and PCR products were electrophoretically resolved on ethidium bromide (0.5 μg mL−1)-containing agarose gels (1.5%, w/v). B, Western-blot analysis of the PAO protein levels using an anti-M-PAO specific antibody (50 μg lane−1) preinoculation and at 12, 24, and 48 hpi. −, Mock treatment; +, PS inoculation. C, PAO specific activity levels in relative activity units (RU). Data are means ± se of three independent experiments, and asterisks indicate statistical significance from the corresponding controls at P < 0.05.
Figure 2.
Figure 2.
Specific activity of ADC, ODC, SAMDC, SPDS, and PA titers in wild-type plants treated with PS. A, ADC, ODC, SAMDC, and SPDS specific activities preinoculation and at 12, 24, and 48 hpi in relative units (RU). B, Western-blot analysis of the ADC protein levels using an anti-ADC specific antibody (30 μg lane−1) preinoculation and at 12, 24, and 48 hpi. −, Mock treatment; +, PS inoculation. C, Put, Spd, and Spm titers preinoculation and at 12, 24, and 48 hpi in relative units compared with the corresponding mock-treated plants. D, Apoplastic Put, Spd, and Spm titers at 12 hpi in relative units compared with the corresponding mock-treated plants. Data are means ± se of three independent experiments, and asterisks indicate statistically significant differences from the corresponding controls at P < 0.05.
Figure 3.
Figure 3.
H2O2 levels in wild-type (WT), S-PAO, and A-PAO transgenic leaves and quantitative in situ ROS localization in the apoplast of wild-type, S-PAO, and A-PAO transgenic lines using TEM and CeCl3, which precipitates in the presence of H2O2, forming black adducts. A, H2O2 levels in leaves infiltrated either with mock inoculant or PS at 12 hpi, indicated as brownish spots. B, Densitometric analysis of the brownish adducts formed, corresponding to H2O2 levels preinoculation and at 12, 24, and 48 hpi. Data are means ± se of three independent experiments, and asterisk indicates statistically significant difference from the corresponding wild-type plants at P < 0.05. RU, Relative units. C, H2O2-specific TEM at 12 hpi. Plants were mock-inoculated or inoculated with PS. Ap, Apoplast; Cl, chloroplast; Vc, vacuole. The arrowhead indicates apoplastic H2O2 accumulation. Bars = 0.4 μm. [See online article for color version of this figure.]
Figure 4.
Figure 4.
Phenotypes and growth rates in wild-type (WT) and S-PAO and A-PAO transgenic plants inoculated with PS, PP, and CMV. A, Phenotypes of leaves inoculated with PS (104: 1 or 5 × 10⁵: 2 colony-forming units [c.f.u.] cm−2 initial inoculum), PP, or CMV. B, Population analysis of leaves treated with PS strain SFP-2124. C, Diameters of the necrotic areas induced by PP infection. Data are means ± se of three independent experiments, and asterisks indicate statistically significant differences from the corresponding controls at P < 0.05. D, Abundance of CMV coat protein-encoding mRNA and equal gel loading according to ethidium bromide (EtBr; 0.5 μg mL−1)-containing agarose gels (1.5%, w/v). [See online article for color version of this figure.]
Figure 5.
Figure 5.
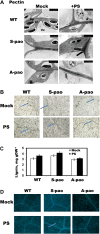
In situ pectin, lignin, and callose quantification in wild-type (WT) and S-PAO and A-PAO transgenic lines, and SA quantitation analysis. A, Pectin-specific TEM results. Plants were mock-inoculated or inoculated with PS at 24 hpi. Ap, Apoplast; Cl, chloroplast; Vc, vacuole. B, In situ lignin content (thicker veins and cell walls shown in gray). C, Lignin content (per mg dry weight [DW]). D, In situ detection of callose deposition in mock- or PS-inoculated leaves at 24 hpi (blue-white areas surrounding the cells). Arrows indicate the accumulation of pectin, lignin, and callose. [See online article for color version of this figure.]
Figure 6.
Figure 6.
Abundance of mRNA of PR-1a, PR-5db, PrxC1, PrxN1, SIPK, WIPK, and NtPAO (endogenous) genes before and after inoculation with PS in wild-type (WT) and S-PAO and A-PAO transgenic plants. mRNA levels were estimated using semiquantitative RT-PCR, and as a loading control the Ubi gene was used. PCR products were electrophoretically resolved on ethidium bromide (0.5 μg mL−1)-containing agarose gels (1.5%, w/v). −, Mock treatment; +, PS inoculation.
Figure 7.
Figure 7.
Abundance of PR-1a and PR-5db mRNAs after exogenous PA application in wild-type (WT) and S-PAO and A-PAO transgenic plants.
Figure 8.
Figure 8.
Accumulation of SA in PS-inoculated leaves at 0, 12, 24, and 48 hpi. The inset shows total SA titers in control plants. FW, Fresh weight; WT, wild type.

References

    1. Abramovitch RB, Anderson JC, Martin GB (2006) Bacterial elicitation and evasion of plant innate immunity. Nat Rev Mol Cell Biol 7 601–611 - PMC - PubMed
    1. Adam L, Somerville SC (1996) Genetic characterization of five powdery mildew disease resistance loci in Arabidopsis thaliana. Plant J 9 341–356 - PubMed
    1. Ahlfors R, Macioszek V, Rudd J, Broscheì M, Schlichting R, Scheel D, Kangasjarvi J (2004) Stress hormone-independent activation and nuclear translocation of mitogen-activated protein kinases in Arabidopsis thaliana during ozone exposure. Plant J 40 512–522 - PubMed
    1. Alcazar R, Marco F, Cuevas JC, Patron M, Ferrando A, Carrasco P, Tiburcio AF, Altabella T (2006) Involvement of polyamines in plant response to abiotic stress. Biotechnol Lett 28 1867–1876 - PubMed
    1. Appiah AA, Jennings P, Turner JA (2004) Phytophthora ramorum: one pathogen and many diseases, an emerging threat to forest ecosystems and ornamental plant life. Mycologist 18 145–150

Publication types

MeSH terms

LinkOut - more resources