. 2009 May;75(5):1084-95.
doi: 10.1124/mol.108.054353. Epub 2009 Feb 13.

Time-resolved photolabeling of the nicotinic acetylcholine receptor by [3H]azietomidate, an open-state inhibitor

Affiliations

Time-resolved photolabeling of the nicotinic acetylcholine receptor by [3H]azietomidate, an open-state inhibitor

David C Chiara et al. Mol Pharmacol. 2009 May.

Abstract

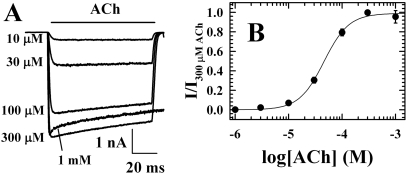
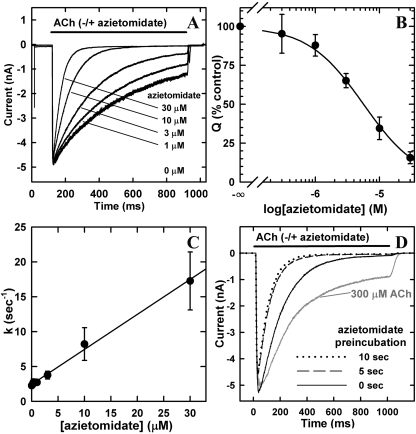
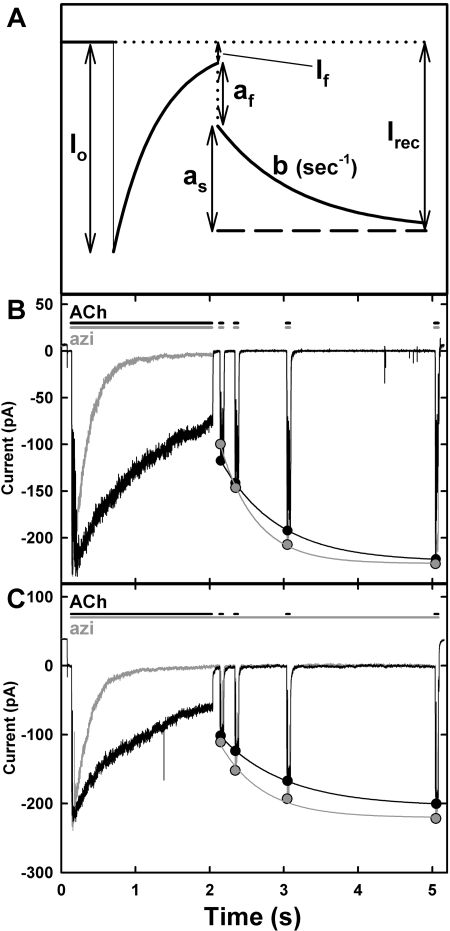
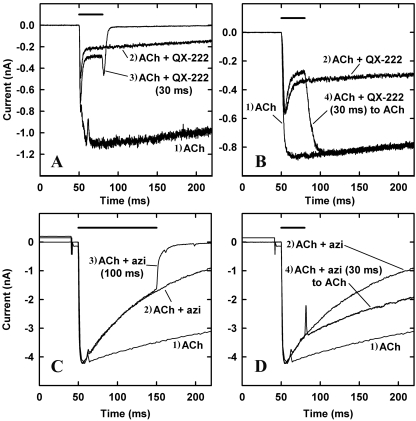
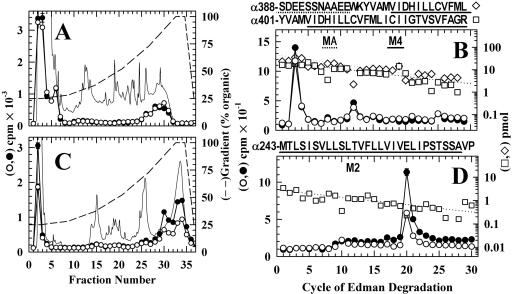
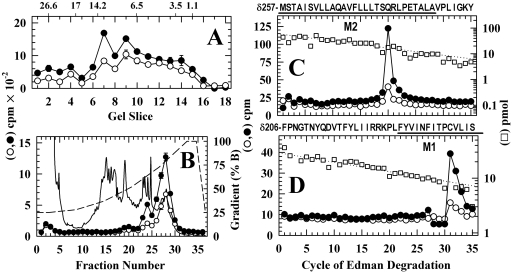
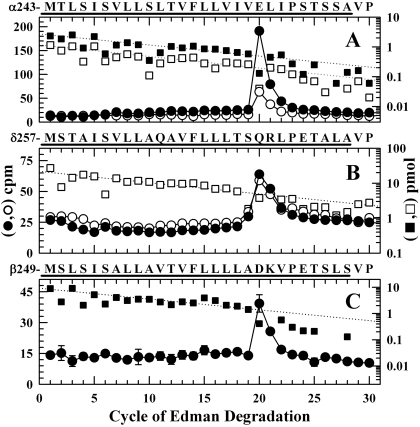
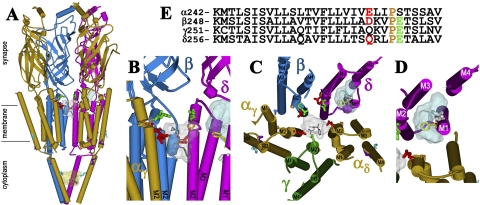
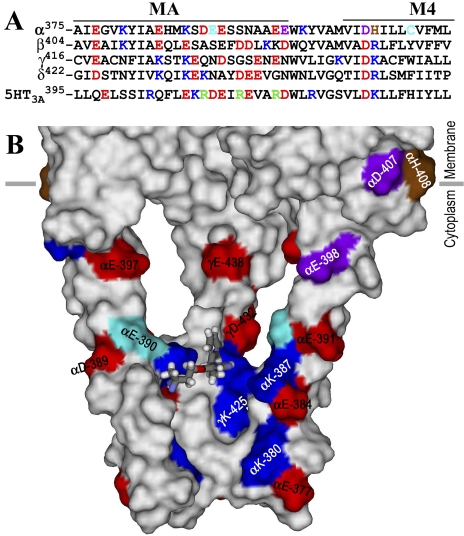
Azietomidate is a photoreactive analog of the general anesthetic etomidate that acts as a nicotinic acetylcholine receptor (nAChR) noncompetitive antagonist. We used rapid perfusion electrophysiological techniques to characterize the state dependence and kinetics of azietomidate inhibition of Torpedo californica nAChRs and time-resolved photolabeling to identify the nAChR binding sites occupied after exposure to [(3)H]azietomidate and agonist for 50 ms (open state) or at equilibrium (desensitized state). Azietomidate acted primarily as an open channel inhibitor characterized by a bimolecular association rate constant of k(+) = 5 x 10(5) M(-1) s(-1) and a dissociation rate constant of <3s(-1). Azietomidate at 10 microM, when perfused with acetylcholine (ACh), inhibited the ACh response by approximately 50% after 50 ms; when preincubated for 10 s, it decreased the peak initial response by approximately 15%. Comparison of the kinetics of recovery of ACh responses after exposure to ACh and azietomidate or to ACh alone indicated that at subsecond times, azietomidate inhibited nAChRs without enhancing the kinetics of agonist-induced desensitization. In nAChRs frozen after 50-ms exposure to agonist and [(3)H]azietomidate, amino acids were photolabeled in the ion channel [position M2-20 (alphaGlu-262, betaAsp-268, deltaGln-276)], in deltaM1 (deltaCys-236), and in alphaMA/alphaM4 (alphaGlu-390, alphaCys-412) that were also photolabeled in nAChRs in the equilibrium desensitized state at approximately half the efficiency. These results identify azietomidate binding sites at the extracellular end of the ion channel, in the delta subunit helix bundle, and in the nAChR cytoplasmic domain that seem similar in structure and accessibility in the open and desensitized states of the nAChR.


Figures

Fig. 1.
Fig. 1.
Responses to ACh measured by rapid perfusion of T. californica nAChRs in detached patches. A, representative macroscopic current responses when an “outside-out” patch at a holding potential of -50 mV was exposed to varying concentrations of ACh for 100 ms. Each trace is the average of four sweeps, with 20 s between each sweep. B, the concentration dependence of the peak ACh responses, with data from two patches normalized to the response to 300 μM ACh and error bars indicating the range. The response was fit by Kapp = 43 ± 4 μM and nH = 1.9 ± 0.2.
Fig. 2.
Fig. 2.
Azietomidate inhibition of T. californica nAChRs. Azietomidate inhibition of ACh responses of T. californica nAChRs expressed in X. laevis oocytes was measured by rapid perfusion of outside-out patches detached from oocytes. A, representative macroscopic current traces from a single patch exposed for 800 ms to 300 μM ACh coapplied with increasing concentrations of azietomidate. For each concentration, the current traces are the average of four repetitions, with 10 s between each sweep. Each trace was normalized to the peak current response for 300 μM ACh applied before each exposure to azietomidate. After exposure to 30 μM azietomidate and 10 s recovery, the peak ACh current was >90% of the previous control, and τdes was decreased by <20% compared with the value before exposure to any azietomidate. B, the concentration dependence of azietomidate inhibition. Responses were measured by the net charge transfer during 800-ms exposure to ACh and azietomidate, normalized for each patch to the value for ACh alone. Data are the mean ± S.E.M. from four patches, and the calculated IC50 was 5.6 ± 0.2 μM. C, dependence of the kinetics of inhibition on azietomidate concentration. For each concentration of azietomidate, the observed decline of the response at time t from the peak was fit to a single exponential: It = I+ (Ipk - I)exp-kt. I is the residual response at long times, Ipk is the peak initial current, and k is the rate constant. Inhibition rates (mean ± S.E.M., three patches) are plotted against azietomidate concentration. Linear least-squares regression gives a slope of 5.0 ± 0.2 × 10⁵ M-1 s-1. D, effect of azietomidate preincubation on the inhibition of T. californica nAChRs in excised patches. The responses of nAChRs exposed to 300 μM ACh and 10 μM azietomidate are shown for a single patch. Before each ACh application, the patch was perfused with 10 μM azietomidate for 0, 5, or 10 s. The calculated net charge transfer during the 1-s response was 2.0 nC for the control in the absence of azietomidate, and 1.1, 0.54, and 0.48 nC after 0, 5, and 10 s of preincubation, respectively.
Fig. 3.
Fig. 3.
Recovery of ACh responses after inhibition by azietomidate. A, a schematic defining the parameters characterizing the kinetics of recovery of ACh responses after exposure to ACh in the absence or presence of azietomidate. After exposure to a stream of ACh ± azietomidate, the patch was switched to a stream that contains buffer, with ACh sensitivity monitored by moving the patch for 50 ms into 300 μM ACh + azietomidate after 0.1, 0.3, 1.0, and 3.0 s of recovery. I0 is the peak initial response to 300 μM ACh ± 10 μM azietomidate; If is the current after 1.95 s. The observed recovery was fit to a single exponential: I = Irec - as exp-bt, where Irec is the current after full recovery, as is the amplitude of the observed slow recovery on the time scale of seconds, and b is the rate constant The amplitude of the rapid phase of recovery, af, is equal to Irec - (as + If). B and C, experimental traces from two patches. The black traces are the ACh controls (1.95-s exposure to 300 μM ACh, followed by recovery in buffer with test pulses of 300 μM ACh), and the gray traces are the currents seen during exposure to ACh + 10 μM azietomidate, followed by recovery in buffer alone (B) or in a stream containing 10 μM azietomidate (C), with recovery tested by exposure to 300 μM ACh and 10 μM azietomidate. Traces shown in B and C are the average of four to six sweeps, each with 20 to 30 s between each sweep. The parameters characterizing the recovery kinetics are detailed in Table 1.
Fig. 4.
Fig. 4.
Comparison of nAChR inhibition by the open channel blocker QX-222 (100 μM, A and B) and by azietomidate (10 μM, C and D). T. californica nAChRs were exposed simultaneously to 300 μM ACh and inhibitor according to four different protocols that are numbered on the traces: 1) 800 ms of ACh, before return to buffer; 2) 800 ms of ACh + inhibitor, before return to buffer; 3) 30 ms of ACh + QX-222 (A) or 100 ms of ACh + azietomidate (C), before return to buffer; or 4) 30 ms of ACh + QX-222 (B) or ACh + azietomidate (D), before return to ACh alone for 170 ms. In each panel, the bar above the current traces indicates the duration of exposure to ACh and QX-222 or azietomidate before switching the patch to a stream of buffer (A and C) or ACh (B and D). A and B are all from a single patch, as are those from C and D. Each trace is an average of four sweeps, with a 20- to 120-s buffer wash between each trial.
Fig. 5.
Fig. 5.
Photolabeling in the nAChR α subunit transmembrane domain after 50-ms exposure to agonist and [3H]azietomidate. nAChR-rich membranes (12 mg/condition) equilibrated without (Open, filled symbols) or with (Des, open symbols) 10 mM Carb were exposed to 10 μM [3H]azietomidate + 10 mM Carb for 50 ms before freezing and photolabeling. After photolabeling, V8 protease digests of the α subunits were fractionated by SDS-PAGE and visualized by Coomassie blue stain, and material was eluted from the 10 kDa (αV8-10) and 20 kDa bands (αV8-20). The left panels are reversed-phase HPLC fractionations of (A) trypsin digests of αV8-10 samples (11,000 cpm injected each condition; recovery >90%) and (C) EndoLys-C digests of αV8-20 (•, 17,300 cpm injected; ○, 9600 cpm injected; 70% recoveries). Also included are the absorbance at 215 nm (dotted line) and the HPLC gradient (% organic). The right panels are 3H (•, ○) and PTH-amino acids (⋄, □) released during sequence analysis of nAChR subunit fragments beginning near the amino terminus of αM4 (pools of HPLC fractions 26-31 from A) (B), and αM2 (pools of HPLC fractions 29-31 from C) (D). The primary amino acid sequences are shown above each panel. B, each sample contained α subunit fragments beginning at αTyr-401 (Des, □, I0 = 23 pmol; Open, I0 = 16 pmol, not shown) and at αSer-388 (Des, ⋄, I0 = 46 pmol; Open, I0 = 28 pmol, not shown). The major peak of 3H release in cycle 3 indicated labeling of αGlu-390, and the minor peaks of 3H release in cycles 12 and 25 indicated labeling of αCys-412 within the fragments beginning at αTyr-401 and αSer-388, respectively. D, each sample contained as the primary sequence the fragment beginning at αMet-243 at the N terminus of αM2 [Open and Des (□), I0 = 2.9 pmol]. The peak of 3H release in cycle 20 indicated labeling of αGlu-262. The pool of HPLC fractions 32 to 35 from C contained fragments beginning at αSer-173 (9 pmol, each condition) and at αMet-243 (7 pmol, each condition) and a single peak of 3H release in cycle 20.
Fig. 6.
Fig. 6.
Photolabeling in the nAChR δ subunit transmembrane domain after 50-ms exposure to agonist and [3H]azietomidate. nAChR δ subunits isolated from the labeling described in Fig. 5 were digested with EndoLys-C and fractionated by Tricine SDS-PAGE. A, the distribution of 3H eluted from 5-mm bands of the gel (Open, •, 26,800 cpm loaded, 14,600 recovered; Des, ○, 17,400 cpm loaded, 10,200 cpm recovered). The mobilities of the molecular mass markers are indicated above the graph. B, reversed-phase HPLC fractionation of material eluted from gel bands 7-9 (•, 6350 cpm injected, 6000 recovered; ○, 4060 cpm injected, 3330 cpm recovered). Also included are the absorbance at 215 nm for the Des sample (solid line) and the HPLC gradient in percent organic phase (dashed line). The right panels are the 3H (•, ○) and PTH-amino acids (□) released during sequence analysis of nAChR subunit fragments beginning at the amino terminus of δM2 (pools of HPLC fractions 26-29) (C) and M1 (pools of HPLC fractions 22-24) (D). C, the primary sequence began at δMet-257 at the N terminus of δM2 (Op, I0 = 61 pmol, not shown; Des, □, I0 = 60 pmol) and secondary sequences began at δAsn-437 (Open, 21 pmol; Des, 20 pmol) and δPhe-206 (Open, 3.7 pmol; Des, 2.8 pmol). The peak of 3H release in cycle 20 was consistent with labeling at δGln-276 from the primary sequence detected. D, the primary sequence began at δPhe-206 before δM1 (Open, I0 = 30 pmol, not shown; Des, □, I0 = 29 pmol). The peak of 3H release in cycle 31 indicated labeling of δCys-236.
Fig. 7.
Fig. 7.
Photolabeling after rapid-freezing of nAChRs equilibrated with [3H]azietomidate and agonist. 3H (•, ○) and PTH-amino acids (▪, □) released during sequence analysis of nAChR subunit fragments beginning at the amino terminus of αM2 (A), δM2 (B), and βM2 (C). The primary amino acid sequences are shown above each panel. nAChR-rich membranes (12 mg/condition), pre-equilibrated with 18 μM [3H]azietomidate either without (filled symbols) or with (open symbols) 10 mM Carb, were exposed to 10 mM Carb for 50 ms and then rapidly frozen for photolabeling. As described under Materials and Methods, the fragments containing αM2 were isolated by reversed-phase HPLC from EndoLys-C digests of αV8-20; the fragments containing at δM2 or βM2 were isolated from an EndoLys-C digests (δ subunit) or trypsin digests (β subunit) by Tricine-gel SDS-PAGE followed by reversed-phase HPLC. A, the primary sequence began at αMet-243 (▪, I0 = 2.7 pmol; □, I0 = 1.2 pmol), and the peak of 3H release in cycle 20 indicated labeling of αGlu-262. B, the primary sequence began at δMet-257 [□, I0 = 22 pmol; not pre-equilibrated with Carb, I0 = 19 pmol (not shown)]. The 3H release in cycle 20 indicated labeling at δGln-276. C, the primary sequence began at the N terminus of βM2 (▪, I0 = 9.2 pmol) and a secondary sequence began at βLys-216 at the N terminus of βM1 (I0 = 5.1 pmol, not shown). The 3H release in cycle 20 indicated labeling at βAsp-268.
Fig. 8.
Fig. 8.
The binding sites for [3H]azietomidate in the nAChR. Views of the T. marmorata nAChR structure (Protein Data Bank code 2BG9) (α, gold; β, blue; γ, green; δ, magenta) showing α-helical (cylinders) and β-sheet (ribbon) secondary structure. A, a perspective parallel to the membrane surface (with the γ subunit omitted). B, an expanded view of A focused on the top of the channel (γ and αδ omitted). C, the transmembrane helices viewed looking down the ion channel. D, the δ subunit helix bundle looking down the M1 helix. E, the amino acid sequences of each of the M2 helices of the nAChR structure, with the amino acids highlighted in the structures indicated by the same colors. The residues labeled by [3H]azietomidate are shown in stick format, color-coded for location: ion channel, position M2-20 (αGlu-262, βAsp-269; and δ-Gln-276; red); the δ subunit helix bundle (δCys-236, white); αM4 (αCys-412; cyan); the cytoplasmic basket formed by the MA helices (αGlu-390, cyan). Also indicated in stick format in the M2 helices are unlabeled acidic side chains (βGlu-273 and δGlu-280; green) that project into the channel lumen and the prolines (orange) that precede those positions in each subunit. δPhe-232 (yellow), the amino acid in δM1 that is photolabeled by [125I]TID (Arevalo et al., 2005) and [3H]benzophenone (Garcia et al., 2007), is included, as are the amino acids in αMA/αM4 (αGlu-398, αAsp-407, purple) photolabeled by [3H]azicholesterol (Hamouda et al., 2006). The volumes defined by the ensemble of the 10 lowest energy orientations of azietomidate docked at the extracellular end of the ion channel (gray, 680 Å3), in the δ subunit helix bundle (blue, 570 Å3), and in the cytoplasmic basket (yellow, 970 Å3) are shown in Connolly surface representations with a single azietomidate docked in its lowest energy orientation in each pocket (see Materials and Methods).
Fig. 9.
Fig. 9.
An azietomidate binding pocket in the nAChR cytoplasmic domain. A, an alignment of the sequences of the T. californica nAChR subunit and human 5-HT3A receptor MA/M4 helices, with the positions in the nAChR α subunit photolabeled by [3H]azietomidate, [3H]azicholesterol (Hamouda et al., 2006), and [3H]azioctanol (Pratt et al., 2000) colored cyan, purple, and brown, respectively. Other acidic and basic amino acids are colored red and blue, respectively. The positions in the 5-HT3A receptor identified as conductance determinants are green (Hales et al., 2006). B, a Connolly surface representation of the basket formed by the MA helices, viewed from the side with the β and δ subunits removed to visualize the interior and with the amino acids color-coded as in (A). An azietomidate molecule in stick format is included docked in its lowest energy orientation (see Materials and Methods).

References

    1. Addona GH, Kloczewiak MA, and Miller KW (1999) Time-resolved photolabeling of membrane proteins: application to the nicotinic acetylcholine receptor. Anal Biochem 267 135-140. - PubMed
    1. Arevalo E, Chiara DC, Forman SA, Cohen JB, and Miller KW (2005) Gating-enhanced accessibility of hydrophobic sites within the transmembrane region of the nicotinic acetylcholine receptor's delta-subunit - a time-resolved photolabeling study. J Biol Chem 280 13631-13640. - PubMed
    1. Arias HR, Kem WR, Trudell JR, and Blanton MP (2003) Unique general anesthetic binding sites within distinct conformational states of the nicotinic acetylcholine receptor. Int Rev Neurobiol 54 1-50. - PubMed
    1. Borghese CM, Ali DN, Bleck V, and Harris RA (2002) Acetylcholine and alcohol sensitivity of neuronal nicotinic acetylcholine receptors: mutations in transmembrane domains. Alcohol Clin Exp Res 26 1764-1772. - PubMed
    1. Chiara DC, Trinidad JC, Wang D, Ziebell MR, Sullivan D, and Cohen JB (2003) Identification of amino acids in the nicotinic acetylcholine receptor agonist binding site and ion channel photolabeled by 4-[(3-trifluoromethyl)-3H-diazirin-3-yl]benzoyllcholine, a novel photoaffinity antagonist. Biochemistry 42 271-283. - PubMed

Publication types

LinkOut - more resources