

Pattern formation by dynamically interacting network motifs
- PMID: 19218441
- PMCID: PMC2651296
- DOI: 10.1073/pnas.0810728106
Pattern formation by dynamically interacting network motifs
Abstract
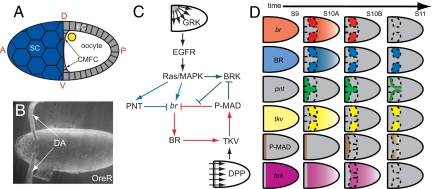
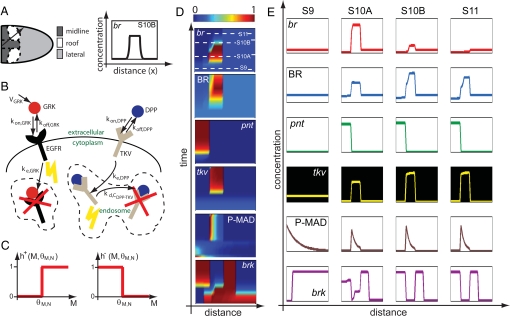
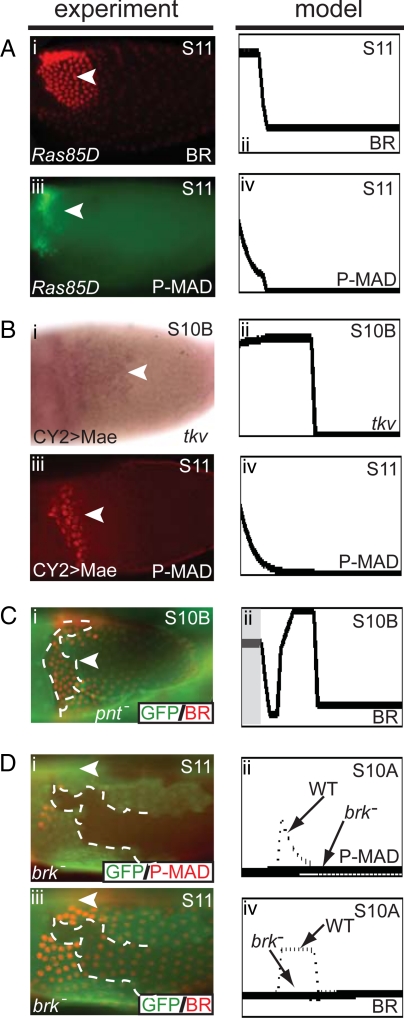
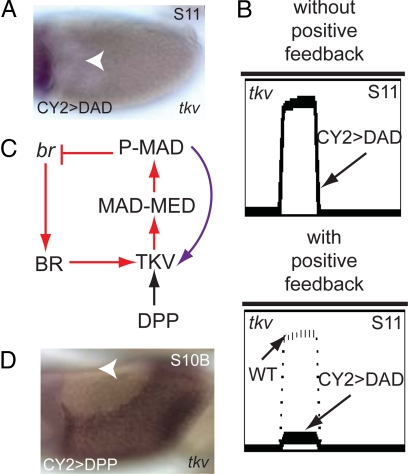
Systematic validation of pattern formation mechanisms revealed by molecular studies of development is essentially impossible without mathematical models. Models can provide a compact summary of a large number of experiments that led to mechanism formulation and guide future studies of pattern formation. Here, we realize this program by analyzing a mathematical model of epithelial patterning by the highly conserved EGFR and BMP signaling pathways in Drosophila oogenesis. The model accounts for the dynamic interaction of the feedforward and feedback network motifs that control the expression of Broad, a zinc finger transcription factor expressed in the cells that form the upper part of the respiratory eggshell appendages. Based on the combination of computational analysis and genetic experiments, we show that the model accounts for the key features of wild-type pattern formation, correctly predicts patterning defects in multiple mutants, and guides the identification of additional regulatory links in a complex pattern formation mechanism.
Conflict of interest statement
The authors declare no conflict of interest.
Figures
Similar articles
-
Pattern formation by a moving morphogen source.Phys Biol. 2011 Aug;8(4):045003. doi: 10.1088/1478-3975/8/4/045003. Epub 2011 Jul 12. Phys Biol. 2011. PMID: 21750363 Free PMC article.
-
Drosophila eggshell is patterned by sequential action of feedforward and feedback loops.Development. 2008 Jan;135(2):343-51. doi: 10.1242/dev.008920. Epub 2007 Dec 12. Development. 2008. PMID: 18077592
-
EGFR-dependent network interactions that pattern Drosophila eggshell appendages.Development. 2012 Aug;139(15):2814-20. doi: 10.1242/dev.077669. Development. 2012. PMID: 22782725
-
Drosophila blastoderm patterning.Curr Opin Genet Dev. 2012 Dec;22(6):533-41. doi: 10.1016/j.gde.2012.10.005. Epub 2013 Jan 4. Curr Opin Genet Dev. 2012. PMID: 23290311 Review.
-
Gradients and thresholds: BMP response gradients unveiled in Drosophila embryos.Trends Genet. 2003 Dec;19(12):701-8. doi: 10.1016/j.tig.2003.10.009. Trends Genet. 2003. PMID: 14642751 Review.
Cited by
-
Pattern formation by receptor tyrosine kinases: analysis of the Gurken gradient in Drosophila oogenesis.Curr Opin Genet Dev. 2011 Dec;21(6):719-25. doi: 10.1016/j.gde.2011.07.009. Epub 2011 Aug 19. Curr Opin Genet Dev. 2011. PMID: 21862318 Free PMC article. Review.
-
Finishing the egg.Genetics. 2024 Jan 3;226(1):iyad183. doi: 10.1093/genetics/iyad183. Genetics. 2024. PMID: 38000906 Free PMC article.
-
Epithelial Patterning, Morphogenesis, and Evolution: Drosophila Eggshell as a Model.Dev Cell. 2017 May 22;41(4):337-348. doi: 10.1016/j.devcel.2017.02.018. Dev Cell. 2017. PMID: 28535370 Free PMC article. Review.
-
Pattern formation by a moving morphogen source.Phys Biol. 2011 Aug;8(4):045003. doi: 10.1088/1478-3975/8/4/045003. Epub 2011 Jul 12. Phys Biol. 2011. PMID: 21750363 Free PMC article.
-
BMP-dependent gene repression cascade in Drosophila eggshell patterning.Dev Biol. 2015 Apr 15;400(2):258-65. doi: 10.1016/j.ydbio.2015.02.004. Epub 2015 Feb 20. Dev Biol. 2015. PMID: 25704512 Free PMC article.
References
-
- Berg CA. The Drosophila shell game: Patterning genes and morphological change. Trends Genet. 2005;21:346–355. - PubMed
-
- Deng WM, Bownes M. Two signalling pathways specify localised expression of the Broad-Complex in Drosophila eggshell patterning and morphogenesis. Development. 1997;124:4639–4647. - PubMed
-
- James KE, Berg CA. Temporal comparison of Broad-Complex expression during eggshell-appendage patterning and morphogenesis in two Drosophila species with different eggshell-appendage numbers. Gene Expr Patterns. 2003;3:629–634. - PubMed
-
- Dorman JB, James KE, Fraser SE, Kiehart DP, Berg CA. bullwinkle is required for epithelial morphogenesis during Drosophila oogenesis. Dev Biol. 2004;267:320–341. - PubMed
Publication types
MeSH terms
Grants and funding
LinkOut - more resources
Full Text Sources
Molecular Biology Databases
Research Materials
Miscellaneous
