

doi: 10.1101/gr.082784.108.
Epub 2009 Feb 13.
Breakpoint graphs and ancestral genome reconstructions
Affiliations
- PMID: 19218533
- PMCID: PMC2675983
- DOI: 10.1101/gr.082784.108
Item in Clipboard
Breakpoint graphs and ancestral genome reconstructions
Genome Res.
2009 May.
Abstract
Recently completed whole-genome sequencing projects marked the transition from gene-based phylogenetic studies to phylogenomics analysis of entire genomes. We developed an algorithm MGRA for reconstructing ancestral genomes and used it to study the rearrangement history of seven mammalian genomes: human, chimpanzee, macaque, mouse, rat, dog, and opossum. MGRA relies on the notion of the multiple breakpoint graphs to overcome some limitations of the existing approaches to ancestral genome reconstructions. MGRA also generates the rearrangement-based characters guiding the phylogenetic tree reconstruction when the phylogeny is unknown.
Figures

(A) Unichromosomal genome P = (+a +b −c) represented as a black-obverse cycle. (B) Unichromosomal genome Q = (+a −b +c) represented as a green-obverse cycle. (C) The breakpoint graph G(P, Q) with and without obverse edges.

(A) A 2-break on edges (x1, x2) and (y1, y2) from the same chromosome corresponds to either a reversal, or a fission. (B) A 2-break on edges (x1, x2) and (y1, y2) from different chromosomes corresponds to a translocation/fusion. (C) A 2-break on edges (y1, y2) and (x1, ∞) of a linear chromosome corresponds to a reversal affecting a chromosome end x1 and creating a new chromosome end y1. (D) A 2-break on edges (x1, ∞) and (y1, ∞) from different chromosomes models a fusion. Fissions can be modeled as 2-breaks operating on an irregular loop edge (∞, ∞) and an arbitrary regular edge in the genome.

(A) A phylogenetic tree T with four linear genomes P1, P2, P3, P4 (represented as green, blue, red, and yellow graphs, respectively) at the leaves. The obverse edges are not shown. (B) The multiple breakpoint graph G(P1, P2, P3, P4) is a superposition of graphs representing genomes P1, P2, P3, P4. The multi-degrees of regular vertices vary from 1 (e.g., vertex bh) to 3 (e.g., vertex eh). (C) The same phylogenetic tree T with all intermediate genomes specified and a genome X selected as a root. A T-consistent transformation of X into P1, P2, P3, P4 can viewed as a transformation of the quadruple (X, X, X, X) into the quadruple (P1, P2, P3, P4), where a rearrangement at each step is applied to some copies of the same genome in the quadruple. A particular such transformation takes the following steps: (X, X, X, X)  (X, X, Q1, Q1)
  (Q3, Q3, Q1, Q1)
  (Q3, Q3, Q2, Q2)
  (Q3, Q3, P3, Q2)
  (Q3, Q3, P3, P4)
  (P1, Q3, P3, P4)
  (P1, P2, P3, P4), where r1 is a reversal in two copies of X; r2 is a fission in two copies of X; r3 is a reversal in both copies of Q1; r4 is a fission in one copy of Q2; r5 is a reversal in the other copy of Q2; r6 is a reversal in one copy of Q3; and r7 is a translocation in the other copy of Q3.
(X, X, Q1, Q1) (Q3, Q3, Q1, Q1) (Q3, Q3, Q2, Q2) (Q3, Q3, P3, Q2) (Q3, Q3, P3, P4) (P1, Q3, P3, P4) (P1, P2, P3, P4), where r1 is a reversal in two copies of X; r2 is a fission in two copies of X; r3 is a reversal in both copies of Q1; r4 is a fission in one copy of Q2; r5 is a reversal in the other copy of Q2; r6 is a reversal in one copy of Q3; and r7 is a translocation in the other copy of Q3.
The breakspoint graph G(M,R,D,Q,H,C) (obverse edges are not shown) of six mammalian genomes: mouse (red edges), rat (blue edges), dog (green edges), macaque (violet edges), human (orange edges), and chimpanzee (yellow edges). The graph has 1357 × 2 = 2714 vertices labeled as nt or nh (where n is a synteny block number) and colored in 23 colors representing chromosomes in the human genome.
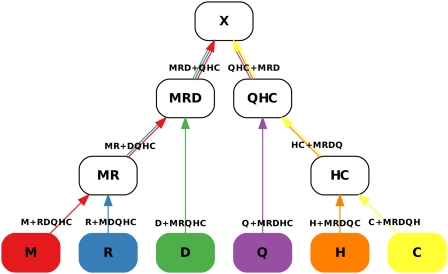
The phylogenetic tree T of six mammalian genomes: mouse (red), rat (blue), dog (green), macaque (violet), human (orange), and chimpanzee (yellow) with a root X on the MRD + QHC branch. The branches are directed toward X and labeled with the corresponding pairs of complementary T-consistent multi-colors. The  -consistent multi-color from each pair also labels the starting node of the corresponding directed branch. Note that the tree orientation may not necessarily correlate with the time scale, and the root genome X may not necessarily be a common ancestor of the leaf genomes.
-consistent multi-color from each pair also labels the starting node of the corresponding directed branch. Note that the tree orientation may not necessarily correlate with the time scale, and the root genome X may not necessarily be a common ancestor of the leaf genomes.
(Top panel) Processing good paths using a -consistent red–blue multi-color. (A) A good path on vertices x1, x2,…, x6 is transformed into a cycle on the same vertices by extending it into x0, x1, x2,…, x6, x7 and performing a 2-break on the multi-edges (x0, x1) and (x6, x7). (B) Transformation of a good cycle on 6 vertices into complete multi-edges with a 2-break on the multi-edges (x1, x2), (x3, x4) followed by a 2-break on the multi-edges (x1, x4), (x5, x6). (C) A 2-break on an irregular edge corresponds to a reversal involving chromosome ends. (D) A 2-break on two irregular edges corresponds to a fusion. (Bottom panel) Two ways of transforming a fair edge (x, y) into a good edge: (top) by a 2-break on yellow edges or (bottom) by a 2-break on green edges. In either case, the follow-up processing of the generated simple path results in the same graph with the complete multi-edge (x, y).
-consistent red–blue multi-color. (A) A good path on vertices x1, x2,…, x6 is transformed into a cycle on the same vertices by extending it into x0, x1, x2,…, x6, x7 and performing a 2-break on the multi-edges (x0, x1) and (x6, x7). (B) Transformation of a good cycle on 6 vertices into complete multi-edges with a 2-break on the multi-edges (x1, x2), (x3, x4) followed by a 2-break on the multi-edges (x1, x4), (x5, x6). (C) A 2-break on an irregular edge corresponds to a reversal involving chromosome ends. (D) A 2-break on two irregular edges corresponds to a fusion. (Bottom panel) Two ways of transforming a fair edge (x, y) into a good edge: (top) by a 2-break on yellow edges or (bottom) by a 2-break on green edges. In either case, the follow-up processing of the generated simple path results in the same graph with the complete multi-edge (x, y).
The breakpoint graph G(M,R,D,Q,H,C) (the complete multi-edges are not shown) after MGRA Stage 1 (top panel) and after MGRA Stages 1–2 (bottom panel). The edge colors represent mouse (red), rat (blue), dog (green), macaque (violet), human (orange), and chimpanzee (yellow) genomes. Vertices are labeled and colored similarly to Figure 4.

(Top panel) The breakpoint graph of the genomes MRDCARs (cyan) and MRD′CARs (orange) reconstructed by inferCARs (common adjacencies are not shown). (Bold edges) Reliable adjacencies (resolved by MGRA Stage 1); (dashed edges) “ambiguous joins” (see Ma et al. 2006) made by inferCARs. Vertex colors are coded as in Figure 4. (Bottom panel) A most parsimonious transformation of one connected component (containing vertices 658h and 652h) of the breakpoint graph G(M,R,D,Q,H,C) from Figure 4. (First panel from left) The initial component is transformed with (second panel) a 2-break in primates, (third panel) a 2-break in rodents, and (fourth panel) two 2-breaks in dog resulting from processing of a good D + MRQCH path.

(Left panel) The primate–rodent–carnivore controversy: an alternative between the primate–rodent (green tree) and the primate–carnivore clades (red tree). (Right panel) The phylogenetic tree T of seven mammalian genomes: mouse (red), rat (blue), dog (green), macaque (violet), human (orange), chimpanzee (yellow), and opossum (brown). Since the opossum branch is subject to a controversy, the dashed branches represent possible variations, while the solid branches are confident and do not depend on the opossum branch.
References
-
- Alekseyev M.A. Multi-break rearrangements and breakpoint re-uses: From circular to linear genomes. J. Comput. Biol. 2008;15:1117–1131. - PubMed
-
- Alekseyev M.A., Pevzner P.A. Whole genome duplications, multi-break rearrangements, and genome halving theorem. Proceedings of the 18th Annual ACM-SIAM Symposium on Discrete Algorithms (SODA); SIAM, Philadelphia. 2007. pp. 665–679.
-
- Alekseyev M.A., Pevzner P.A. Multi-break rearrangements and chromosomal evolution. Theor. Comput. Sci. 2008;395:193–202.
-
- Amrine-Madsen H., Koepfli K.-P., Wayne R.K., Springer M.S. A new phylogenetic marker, apolipoprotein B, provides compelling evidence for eutherian relationships. Mol. Phylogenet. Evol. 2003;28:225–240. - PubMed
Publication types
MeSH terms
Grants and funding
LinkOut - more resources
Full Text Sources
Other Literature Sources