. 2009 Jun;50(6):1080-9.
doi: 10.1194/jlr.M800555-JLR200. Epub 2009 Feb 13.

A dynamic, cytoplasmic triacylglycerol pool in enterocytes revealed by ex vivo and in vivo coherent anti-Stokes Raman scattering imaging

Affiliations

A dynamic, cytoplasmic triacylglycerol pool in enterocytes revealed by ex vivo and in vivo coherent anti-Stokes Raman scattering imaging

Jiabin Zhu et al. J Lipid Res. 2009 Jun.

Abstract

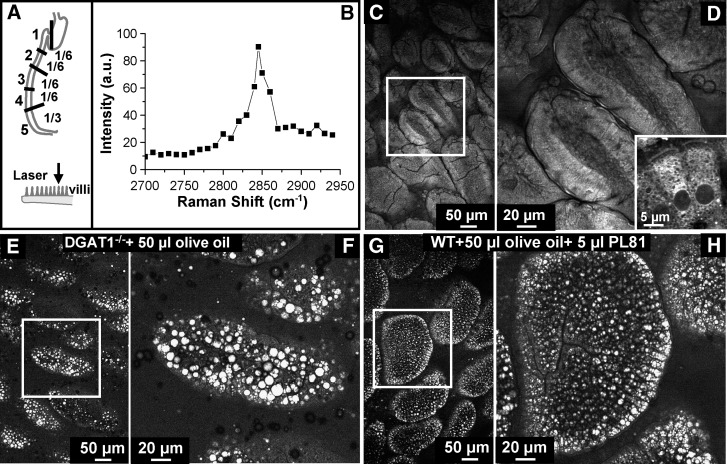
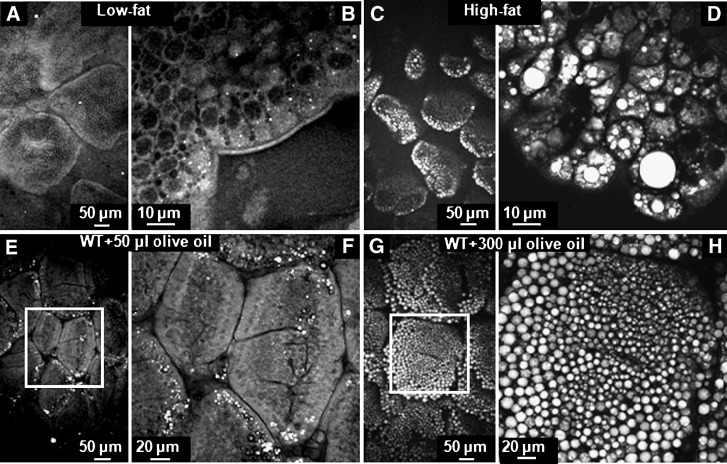
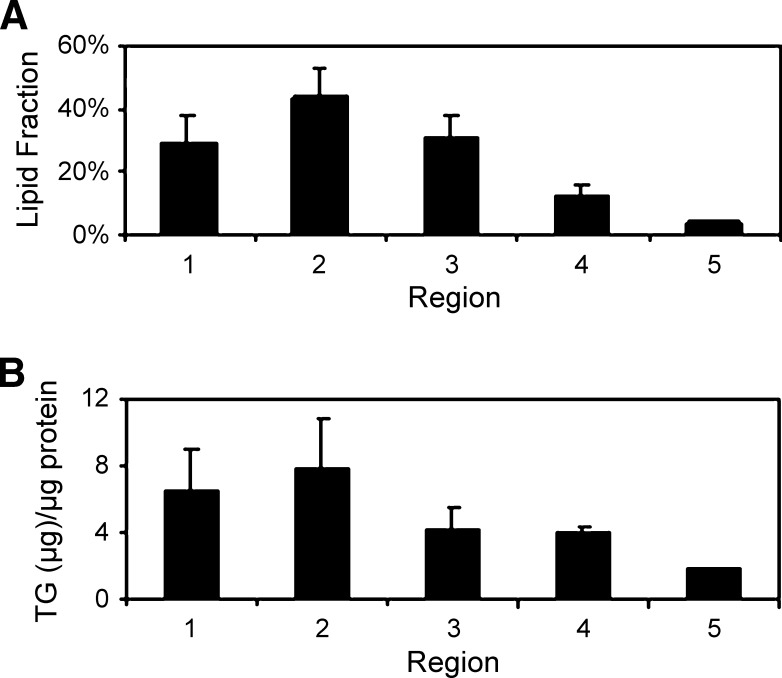
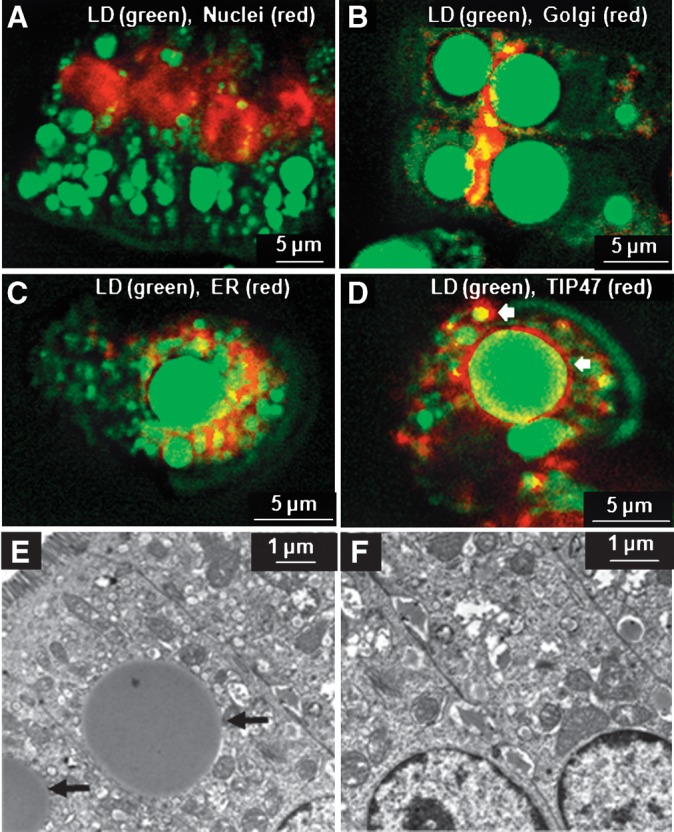
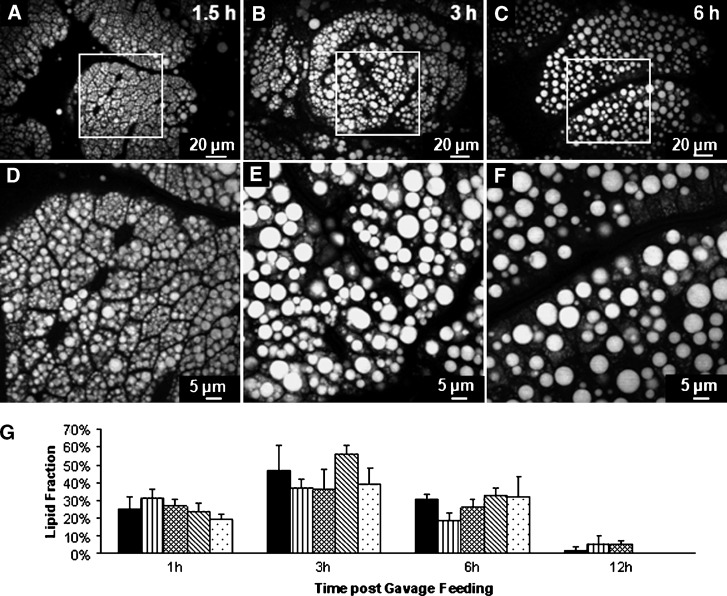
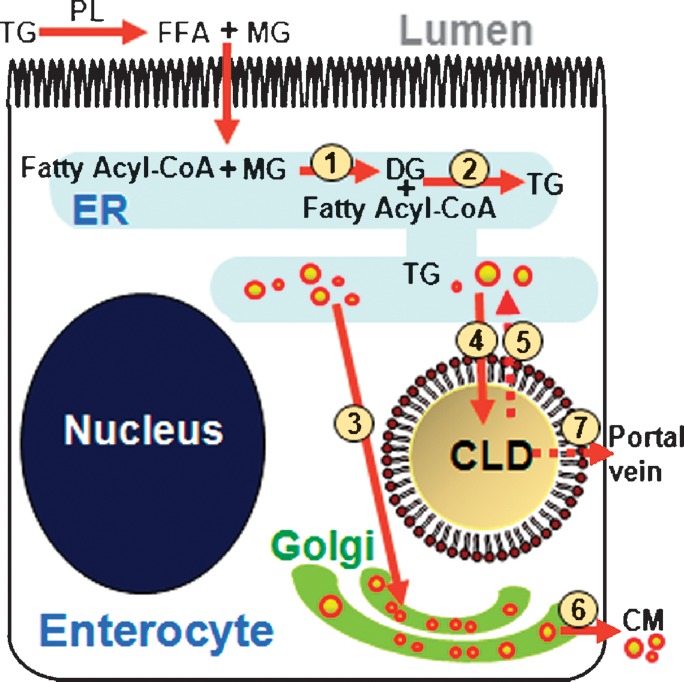
The absorptive cells of the small intestine, enterocytes, are not generally thought of as a cell type that stores triacylglycerols (TGs) in cytoplasmic lipid droplets (LDs). We revisit TG metabolism in enterocytes by ex vivo and in vivo coherent anti-Stokes Raman scattering (CARS) imaging of small intestine of mice during dietary fat absorption (DFA). We directly visualized the presence of LDs in enterocytes. We determined lipid amount and quantified LD number and size as a function of intestinal location and time post-lipid challenge via gavage feeding. The LDs were confirmed to be primarily TG by biochemical analysis. Combined CARS and fluorescence imaging indicated that the large LDs were located in the cytoplasm, associated with the tail-interacting protein of 47 kDa. Furthermore, in vivo CARS imaging showed real-time variation in the amount of TG stored in LDs through the process of DFA. Our results highlight a dynamic, cytoplasmic TG pool in enterocytes that may play previously unexpected roles in processes, such as regulating postprandial blood TG concentrations.


Figures

Fig. 1.
Fig. 1.
Validation of CARS microscopy for imaging LDs in enterocytes. A: Mouse small intestine was divided into five regions. Tissues from region 2 were cut open longitudinally and imaged in lumen view. B: CARS spectrum of lipids in the small intestine. C, D: CARS image of villi from wide type mice fasted 4 h. A monolayer of enterocytes constitutes the outer layer of each villus, and the microvilli are evident on the apical side of enterocytes. Inset of D shows a CARS image of two enterocytes. The cytoplasmic organelles show a bright contrast due to the abundant CH2 groups in their phospholipid membranes. The nuclei display a dark contrast. E, F: Enterocytes from DGAT1-deficient mice fed 50 μl oil via oral gavage and 3 h after gavage show a high level of LD accumulation with the diameter of LDs up to 9 μm. G, H: Enterocytes from mice fed 50 μl olive oil with 5 μl PL81 via oral gavage and 3 h after gavage show a high level of small LD accumulation. D, F, and H are zoom-in views of the squares in C, E, and G, respectively.
Fig. 2.
Fig. 2.
TG storage in LDs correlates with amount of dietary fat consumed. A–D: CARS images of small intestine tissue (region 2) dissected from mice fed low-fat (A, B) and high-fat (C, D) diets for 3 weeks. A and C were taken with a 20× air objective. B and D were taken with a 60× water objective. E–H: CARS images of the small intestine from mice fed 50 μL (E, F) and 300 μl (G, H) olive oil via oral gavage, 3 h afer gavage. F and H are zoom-in views of the squares in E and G, respectively.
Fig. 3.
Fig. 3.
TG storage in LDs in enterocytes is small intestine region specific. A: Image J analysis of lipid amount in different regions (n = 5 mice, 5–6 villi per mouse were analyzed for each region). B: Biochemical TG analysis among different regions by a colorimetric assay (n = 3 mice).
Fig. 4.
Fig. 4.
Subcellular localization of LDs by CARS (green) and fluorescence (red) microscopy. A: Enterocytes were labeled by Hoechst to visualize nucleus by TPEF. LDs were located in the extranuclear region. B: Enterocytes were labeled with BODIPY ceramide to visualize the Golgi complex by TPEF. Large LDs were located outside the Golgi complex, whereas some small LDs overlapped with the Golgi. C: Overlaid CARS and confocal fluorescence image of an isolated enterocyte labeled with PDI antibody used as an ER marker. Large LDs rarely overlapped with the PDI antibody signal. D: Overlaid CARS and confocal fluorescence image of an isolated enterocyte labeled with TIP47 antibody used as a marker of CLDs. The large LDs in enterocytes were coated with TIP47 protein. For A–D, enterocytes were isolated from mice fed 300 μl olive oil via oral gavage and sacrificed at 3 h afer gavage feeding. E, F: Electron microscopy images of single enterocytes in fixed small intestine tissues extracted from mice fed 300 μl olive oil and sacrificed at 3 h after feeding. Large LDs (indicated by arrows) are visible in the cytoplasm of some enterocytes (E). However, some enterocytes in the same tissue showed no LDs (F), indicating large cell-to-cell variability.
Fig. 5.
Fig. 5.
In vivo CARS imaging demonstrates dynamic accumulation and depletion of TG in CLDs during the process of DFA. A, D: At 1.5 h after gavage of 300 μl olive oil, enterocytes were filled with small CLDs with an average diameter of 2.7 μm. B, E: At 3 h after gavage, larger CLDs with an average diameter of 4.4 μm were observed, implying the occurrence of LD fusion. C, F: At 6 h after gavage, compared with the level at 3 h after gavage, the CLD accumulation decreased with an average diameter of 3.5 μm. To estimate the change of lipid size in vivo at different times after gavage feeding, 8,897 LDs at 1.5 h, 3,595 LDs at 3 h, and 1,698 LDs at 6 h were used. D–F are zoom-in views of A–C, respectively. G: Variation of the amount of LDs based on the area of LD in enterocytes with different times after consumption of dietary fat. Ex vivo CARS images of region 2 small intestine tissues were obtained from five mice for 1, 3, and 6 h time points (at least 50 villi total at each time point) and from 3 mice for 12 h time point (40 villi) and analyzed by Image J software.
Fig. 6.
Fig. 6.
Model of the DFA process based on the finding of TG storage in CLDs within enterocytes. Dietary TG is hydrolyzed in the small intestine lumen by pancreatic lipase to FFA and MG. These products are taken up by the enterocyte where they are rapidly resynthesized in ER (steps 1 and 2) to form TG. Within the ER, the TG is packaged in the core of CMs where it is secreted via the Golgi complex into lymphatics (steps 3 and 6). Alternatively, TG synthesized in the ER may be stored in CLDs (step 4). TG stored in CLDs may be hydrolyzed by a lipase, such as pancreatic TG lipase or TG hydrolase. The hydrolyzed products of TG from CLDs may be transported back to the ER (step 5) and reenter the secretory pathway (steps 3 and 6) or excreted via the portal vein (step 7). Alternatively, hydrolyzed products may be catabolized within the enterocyte or used for other complex lipid synthesis, such as cholesterol esters or phospholipids (data not shown). DG, diacylglycerol; PL, pancreatic lipase.

References

    1. Tso P., J. Balint, M. Bishop, and J. Rodgers. 1981. Acute inhibition of intestinal lipid transport by Pluronic L-81 in the rat. Am. J. Physiol. 241 G487–G497. - PubMed
    1. Phan C. T., and P. Tso. 2001. Intestinal lipid absorption and transport. Front. Biosci. 6 d299–d319. - PubMed
    1. Mansbach II C. M., and F. S. Gorelick. 2007. Development of physiological regulation of intestinal lipid absorption. II. Dietary lipid absorption, complex lipid synthesis, and the intracellular packaging and secretion of chylomirons. Am. J. Physiol. Gastrointest. Liver Physiol. 293 G645–G650. - PubMed
    1. Christensen N. J., C. E. Rubin, M. C. Cheung, and J. J. Albers. 1983. Ultrastructural immunolocalization of apolipoprotein B within human jejunal absorptive cells. J. Lipid Res. 24 1229–1242. - PubMed
    1. Hamilton R. L., J. S. Wong, C. M. Cham, L. B. Nielsen, and S. G. Young. 1998. Chylomicron-sized lipid particles are formed in the setting of apolipoprotein B deficiency. J. Lipid Res. 39 1543–1557. - PubMed

Publication types