. 2009 Apr;10(4):406-12.
doi: 10.1038/embor.2009.5. Epub 2009 Feb 13.

A model for DNA replication showing how dormant origins safeguard against replication fork failure

Affiliations

A model for DNA replication showing how dormant origins safeguard against replication fork failure

J Julian Blow et al. EMBO Rep. 2009 Apr.

Abstract

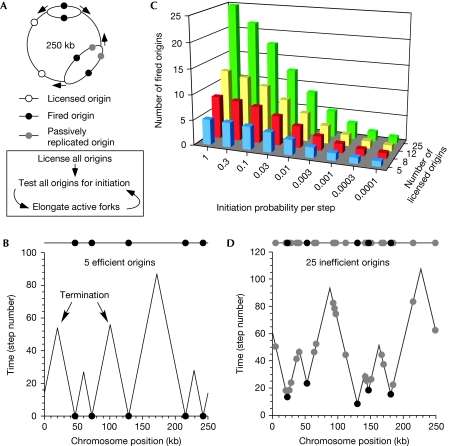
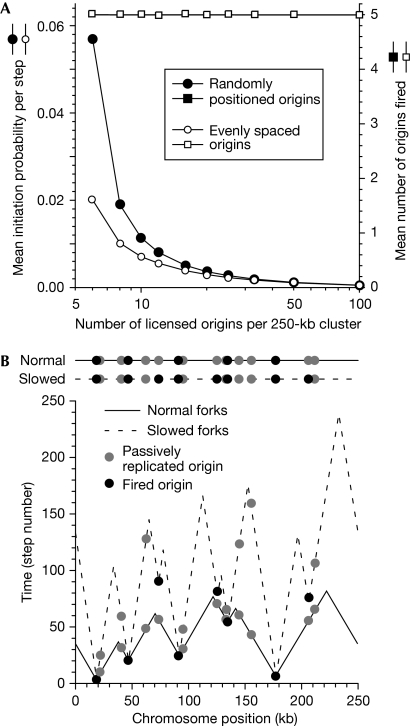
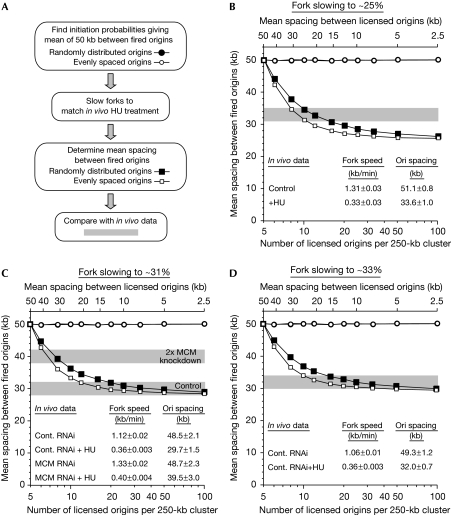
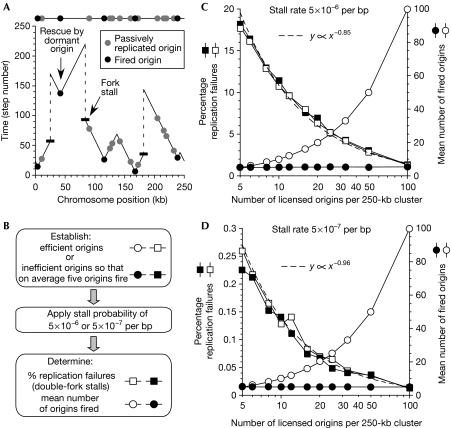
Replication origins are 'licensed' for a single initiation event before entry into S phase; however, many licensed replication origins are not used, but instead remain dormant. The use of these dormant origins helps cells to survive replication stresses that block replication fork movement. Here, we present a computer model of the replication of a typical metazoan origin cluster in which origins are assigned a certain initiation probability per unit time and are then activated stochastically during S phase. The output of this model is in good agreement with experimental data and shows how inefficient dormant origins can be activated when replication forks are inhibited. The model also shows how dormant origins can allow replication to complete even if some forks stall irreversibly. This provides a simple explanation for how replication origin firing is regulated, which simultaneously provides protection against replicative stress while minimizing the cost of using large numbers of replication forks.


Conflict of interest statement

The authors declare that they have no conflict of interest.

Figures

Figure 1
Figure 1
Modelling efficient and inefficient origins. (A) A diagram of a circular replicon cluster containing five origins. Two of these origins have fired and one has been passively replicated. Arrows show the direction of fork movement. The model sequence (initial origin licensing, followed by repeated steps of initiation and elongation) is shown below. (B) An example of replication of the cluster by five randomly spaced efficient origins (initiation probability per step=1). (C) The average initiation probability (x-axis) and the number of randomly spaced licensed origins per 250-kb cluster (z-axis) were varied. The average number of origins that fired was then determined (y-axis). (D) An example of replication of a cluster by 25 randomly spaced inefficient origins (mean initiation probability=0.003).
Figure 2
Figure 2
Activating dormant origins. (A) Initiation probabilities were determined that maintained an average of five origins fired per 250-kb replicon cluster, whereas the number of licensed origins varied from 5 to 100. The average number of fired origins (squares) and the average initiation probability (circles) are plotted for randomly distributed (filled symbols) or evenly spaced origins (open symbols). The x-axis shows the number of licensed origins per cluster (log scale). (B) Example showing the effect of fork slowing. Sixteen randomly positioned origins were licensed with a mean initiation probability of 0.00508. The model was first run with a fork speed of 25% of normal (dashed lines) and the outcome with a normal fork speed was then derived (solid lines). Black circles, initiation events; grey circles, passively replicated origins.
Figure 3
Figure 3
Comparison of in vivo and in silico results. (A) Diagram showing the steps involved in modelling the in vivo data. (BD) The number of licensed origins per 250-kb cluster was varied from 5 to 100; the mean initiation probability was also varied to maintain an average of five initiation events per cluster at normal fork rates (circles). The fork rate was then reduced to (B) 25%, (C) 31% or (D) 33% to match results obtained in vivo after treating U2OS cells with HU (Ge et al, 2007). For (C), the fork rate reduction to 31% was derived from the mean rates obtained with control and MCM RNAi. The mean spacing between fired origins is plotted (squares) for randomly distributed origins (open symbols) and evenly spaced origins (filled symbols). The matching in vivo data are presented within the relevant graph (values±s.e.m.) and the approximate origin spacing after HU treatment is indicated in grey (mean value±2 kb, to indicate the approximate experimental variability). In (C), the effect of an approximately twofold knockdown of chromatin-bound MCM2–7 is also presented (Ge et al, 2007). The x-axis at the bottom shows the number of licensed origins per 250-kb cluster (log scale); at the top, this is expressed as the mean spacing between licensed origins. Cont., control; HU, hydroxyurea; Ori, origin; RNAi, RNA interference.
Figure 4
Figure 4
The effect of fork stalling. (A) An example showing the effect of fork stalling. Sixteen randomly positioned origins were licensed on a 250-kb cluster (mean spacing 15 kb) with a mean initiation probability of 0.00508 (five origins fired on average). The cluster was then replicated with a fork stall probability of 10−5 per base pair. Black circles, initiation events; grey circles, passively replicated origins; thick horizontal bars, fork stalls. (BD) The number of licensed origins per 250-kb cluster was varied from 5 to 100; the mean initiation probability was also varied to maintain an average of five initiation events per cluster in the absence of fork stalling (filled symbols). The same number of licensed origins was also created and given an initiation probability of 1 (efficient origins; open symbols). Clusters were then replicated with fork stall probabilities of either (C) 5 × 10⁻⁶ or (D) 5 × 10⁻⁷ per base pair. The percentage of replication failures (squares) and the total number of fired origins (circles) are shown. Curve fitting was used to fit the number of replication failures (dashed lines).

References

    1. Anglana M, Apiou F, Bensimon A, Debatisse M (2003) Dynamics of DNA replication in mammalian somatic cells: nucleotide pool modulates origin choice and interorigin spacing. Cell 114: 385–394 - PubMed
    1. Arias EE, Walter JC (2007) Strength in numbers: preventing rereplication via multiple mechanisms in eukaryotic cells. Genes Dev 21: 497–518 - PubMed
    1. Berezney R, Dubey DD, Huberman JA (2000) Heterogeneity of eukaryotic replicons, replicon clusters, and replication foci. Chromosoma 108: 471–484 - PubMed
    1. Blow JJ, Dutta A (2005) Preventing re-replication of chromosomal DNA. Nat Rev Mol Cell Biol 6: 476–486 - PMC - PubMed
    1. Blow JJ, Ge XQ (2008) Replication forks, chromatin loops and dormant replication origins. Genome Biol 9: 244. - PMC - PubMed

Publication types