. 2009 Oct;30(10):3188-99.
doi: 10.1002/hbm.20740.

Measurement of cortical thickness from MRI by minimum line integrals on soft-classified tissue

Affiliations

Measurement of cortical thickness from MRI by minimum line integrals on soft-classified tissue

Iman Aganj et al. Hum Brain Mapp. 2009 Oct.

Abstract

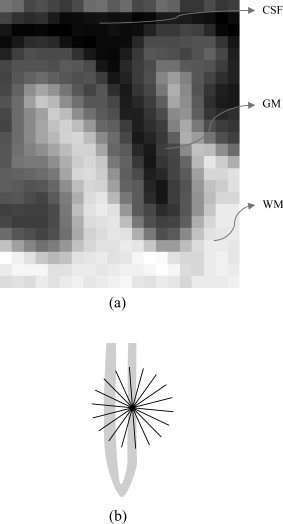
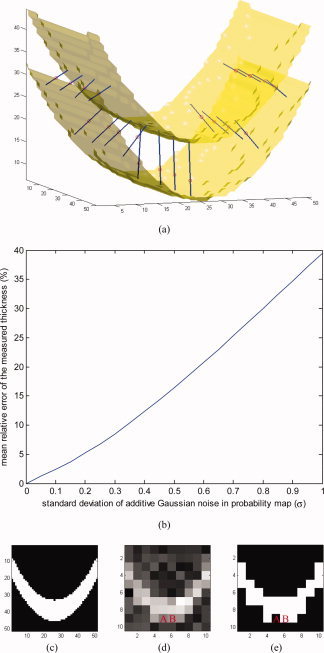
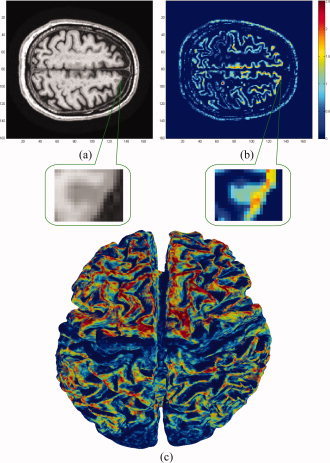
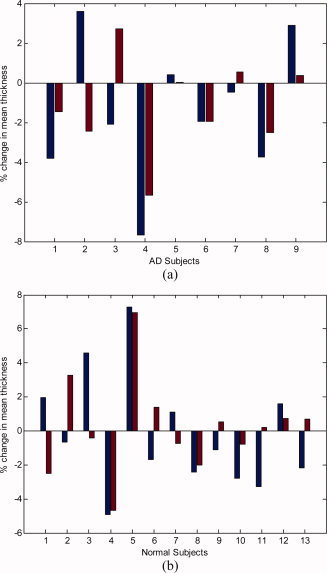
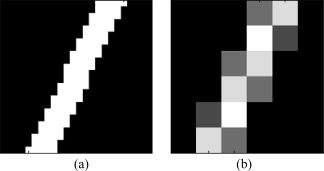
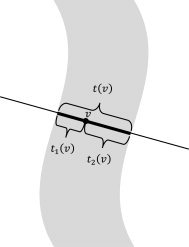
Estimating the thickness of the cerebral cortex is a key step in many brain imaging studies, revealing valuable information on development or disease progression. In this work, we present a framework for measuring the cortical thickness, based on minimizing line integrals over the probability map of the gray matter in the MRI volume. We first prepare a probability map that contains the probability of each voxel belonging to the gray matter. Then, the thickness is basically defined for each voxel as the minimum line integral of the probability map on line segments centered at the point of interest. In contrast to our approach, previous methods often perform a binary-valued hard segmentation of the gray matter before measuring the cortical thickness. Because of image noise and partial volume effects, such a hard classification ignores the underlying tissue class probabilities assigned to each voxel, discarding potentially useful information. We describe our proposed method and demonstrate its performance on both artificial volumes and real 3D brain MRI data from subjects with Alzheimer's disease and healthy individuals.


Figures

Figure 1
Figure 1
Common ways of measuring cortical thickness. (a) Coupled‐surface methods. (b) Closest point methods. (c) Laplace (“heat‐flow”) methods. (d) Largest enclosed sphere methods. [Color figure can be viewed in the online issue, which is available at www.interscience.wiley.com.]
Figure 2
Figure 2
Computing line integrals passing through a point, and choosing the minimum integral value as the thickness. (a) Binary probability map. (b) Continuous probability map.
Figure 3
Figure 3
(ac) An intuitive way of measuring the thickness of an object. (df) Our algorithm produces results similar to this intuitive approach.
Figure 4
Figure 4
(a) A sulcus in which two sides of the gray matter layer are close to each other. (b) How the algorithm might overestimate the thickness if no stopping criteria were used.
Figure 5
Figure 5
Results on an artificial probability map. (a) Inner and outer surfaces of a parabolic‐shaped layer of “GM” are depicted. Line segments are chosen by the algorithm such that they give the smallest integrals (of the probability map) among all line segments passing through every selected test point, here shown as small circles. (b) Relative error in measured thickness, introduced by additive Gaussian noise. (c) A 2D slice of the volume. (d) The same slice in a five‐times‐lower‐resolution volume with additive Gaussian noise. (e) Binary classification of the low‐resolution volume. [Color figure can be viewed in the online issue, which is available at www.interscience.wiley.com.]
Figure 6
Figure 6
Experimental results on MRI data. All computations were done in 3D. A zoomed‐in version of a sulcus is shown where low resolution results in overestimation of the cortical thickness. (a) A slice of the original volume. (b) The thickness map of the same slice (blue thinner, red thicker). (c) 3D mapping of the cortical thickness. Note the thinner areas in the pre/post central gyri. [Color figure can be viewed in the online issue, which is available at www.interscience.wiley.com.]
Figure 7
Figure 7
Relative change in the mean cortical thickness over a 1‐year interval, comparing our results (left blue bars) with the results from FreeSurfer (right red bars). (a) Subjects diagnosed with Alzheimer's disease (AD). (b) Normal elderly subjects. [Color figure can be viewed in the online issue, which is available at www.interscience.wiley.com.]
Figure A1
Figure A1
Illustration of how line integral masks are generated. (a) A high‐resolution binary mask, which is four times larger in each direction, is first generated. (b) The real‐size nonbinary mask is produced by downsampling the binary mask.
Figure A2
Figure A2
The lengths, t 1(v) and t 2(v), of the two sub‐segments are used in finding the gray matter skeleton for computing the cortical thickness variation.

References

    1. Aganj I,Sapiro G,Parikshak N,Madsen SK,Thompson P ( 2008): Segmentation‐free measurement of cortical thickness from MRI. Proc ISBI 2008: 1625–1628. - PMC - PubMed
    1. Choi HS,Haynor DR,Kim YM ( 1989): Multivariate tissue classification of MRI images for 3‐D volume reconstruction—A statistical approach. Proc SPIE Med Imaging III: Image Process 1092: 183–193.
    1. Choi HS,Haynor DR,Kim YM ( 1991): Partial volume tissue classification of multichannel magnetic resonance images—A mixel model. IEEE Trans Med Imaging 10: 395–407. - PubMed
    1. Chung MK,Worsley KJ,Taylor J,Ramsay JO,Robbins S,Evans AC ( 2001): Diffusion smoothing on the cortical surface. Neuroimage 13 ( Suppl 1): 95.
    1. Fischl B,Dale AM ( 2000): Measuring the thickness of the human cerebral cortex from magnetic resonance images. Proc Natl Acad Sci USA 97: 11050–11055. - PMC - PubMed

Publication types