

Pain on injection with microemulsion propofol
- PMID: 19220277
- PMCID: PMC2675042
- DOI: 10.1111/j.1365-2125.2008.03358.x
Pain on injection with microemulsion propofol
Abstract
Aims: To evaluate the incidence and severity of injection pain caused by microemulsion propofol and lipid emulsion propofol in relation to plasma bradykinin generation and aqueous free propofol concentrations.
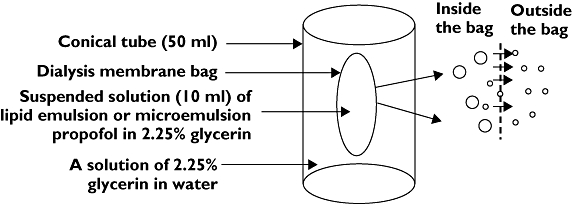
Methods: Injection pain was evaluated in 147 patients. Aqueous free propofol concentrations in each formulation, and in formulation mixtures containing agents that reduce propofol-induced pain, were measured by high-performance liquid chromatography. Plasma bradykinin concentrations in both formulations and in their components mixed with blood sampled from six volunteers were measured by radioimmunoassays. Injection pain caused by 8% polyethylene glycol 660 hydroxystearate (PEG660 HS) was evaluated in another 10 volunteers.
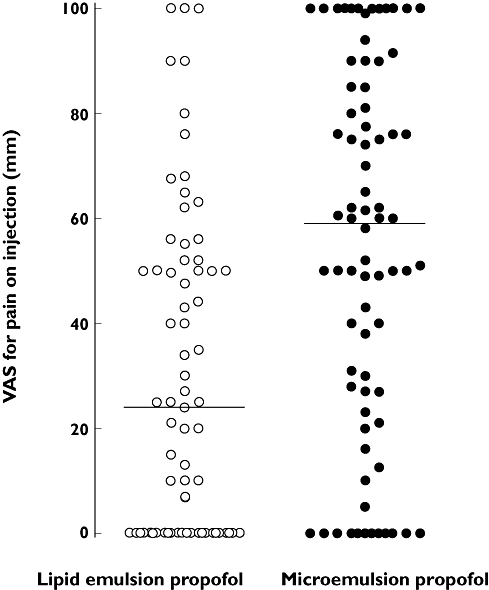
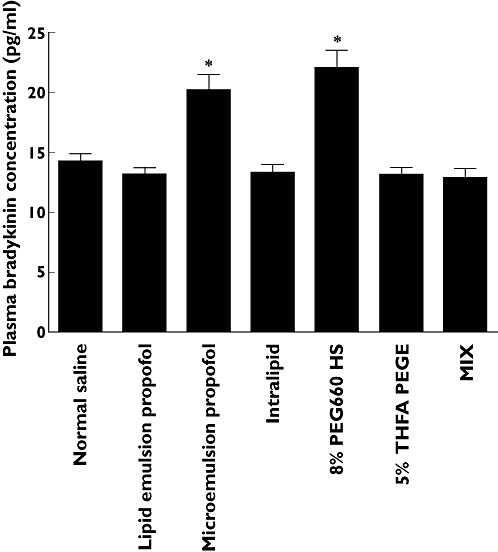
Results: The incidence of injection pain [visual analogue scale (VAS) >30 mm] caused by microemulsion and lipid emulsion propofol was 69.7 and 42.3% (P < 0.001), respectively. The median VAS scores for microemulsion and lipid emulsion propofol were 59 and 24 mm, respectively (95% confidence interval for the difference 12.5, 40.0). The aqueous free propofol concentration of microemulsion propofol was seven times higher than that of lipid emulsion propofol. Agents that reduce injection pain did not affect aqueous free propofol concentrations. Microemulsion propofol and 8% PEG660 HS enhanced plasma bradykinin generation, whereas lipid emulsion propofol and lipid solvent did not. PEG660 HS did not cause injection pain.
Conclusions: Higher aqueous free propofol concentrations of microemulsion propofol produce more frequent and severe pain. The plasma kallikrein-kinin system may not be involved, and the agents that reduce injection pain may not act by decreasing aqueous free propofol concentrations.
Figures
References
-
- Devlin JW, Lau AK, Tanios MA. Propofol-associated hypertriglyceridemia and pancreatitis in the intensive care unit: an analysis of frequency and risk factors. Pharmacotherapy. 2005;25:1348–52. - PubMed
-
- Baker MT, Naguib M. Propofol: the challenges of formulation. Anesthesiology. 2005;103:860–76. - PubMed
-
- Picard P, Tramer MR. Prevention of pain on injection with propofol: a quantitative systematic review. Anesth Analg. 2000;90:963–9. - PubMed
-
- Kim KM, Choi BM, Park SW, Lee SH, Christensen LV, Zhou J, Yoo BH, Shin HW, Bae KS, Kern SE, Kang SH, Noh GJ. Pharmacokinetics and pharmacodynamics of propofol microemulsion and lipid emulsion after an intravenous bolus and variable rate infusion. Anesthesiology. 2007;106:924–34. - PubMed
-
- Klement W, Arndt JO. Pain on injection of propofol: effects of concentration and diluent. Br J Anaesth. 1991;67:281–4. - PubMed
Publication types
MeSH terms
Substances
LinkOut - more resources
Full Text Sources
Other Literature Sources
Medical
