. 2009 Jul;21(7):746-e46.
doi: 10.1111/j.1365-2982.2008.01245.x. Epub 2009 Feb 8.

Effect of age on the enteric nervous system of the human colon

Affiliations

Effect of age on the enteric nervous system of the human colon

C E Bernard et al. Neurogastroenterol Motil. 2009 Jul.

Abstract

The effect of age on the anatomy and function of the human colon is incompletely understood. The prevalence of disorders in adults such as constipation increase with age but it is unclear if this is due to confounding factors or age-related structural defects. The aim of this study was to determine number and subtypes of enteric neurons and neuronal volumes in the human colon of different ages. Normal colon (descending and sigmoid) from 16 patients (nine male) was studied; ages 33-99. Antibodies to HuC/D, choline acetyltransferase (ChAT), neuronal nitric oxide synthase (nNOS), and protein gene product 9.5 were used. Effect of age was determined by testing for linear trends using regression analysis. In the myenteric plexus, number of Hu-positive neurons declined with age (slope = -1.3 neurons/mm/10 years, P = 0.03). The number of ChAT-positive neurons also declined with age (slope = -1.1 neurons/mm/10 years of age, P = 0.02). The number of nNOS-positive neurons did not decline with age. As a result, the ratio of nNOS to Hu increased (slope = 0.03 per 10 years of age, P = 0.01). In the submucosal plexus, the number of neurons did not decline with age (slope = -0.3 neurons/mm/10 years, P = 0.09). Volume of nerve fibres in the circular muscle and volume of neuronal structures in the myenteric plexus did not change with age. In conclusion, the number of neurons in the human colon declines with age with sparing of nNOS-positive neurons. This change was not accompanied by changes in total volume of neuronal structures suggesting compensatory changes in the remaining neurons.


Figures

Figure 1
Figure 1
Methodology used to count neurons and determine volumes. Panel A shows a tissue section marked with a trace tool applied from Analyze™ on myenteric and submucosal plexuses to determine length. Scale bar 1 mm. Panel B shows a ganglion immunolabeled with an antibody to HuC/D to identify neurons. Scale bar, 20μm. Panel C shows a confocal image immunolabeled with an antibody to PGP9.5 to identify neuronal structures. The image was imported into Analyze™ for thresholding and reconstruction of the myenteric plexus neuronal volume (panel D). Scale bar, 100μm. SMP=submucosal plexus, MP = myenteric plexus.
Figure 2
Figure 2
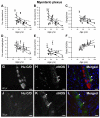
Changes in neuronal numbers in the myenteric plexus of the normal human colon with age. The number of Hu-positive (A) and ChAT-positive (B) neurons/mm decreased with age (slope = −1.3 neurons/mm/10yrs, p=0.03, − 1.1 neurons/mm/10 yrs, p=0.02 respectively). The number of ganglia per mm and neurons/ganglion trended to but did not reach a statistically significant decrease with age (slope = −0.12 ganglia/mm/10yrs, p=0.06, Figure 2C; −0.5 neurons/ganglion per 10 yrs, p=0.06, Figure 2D, respectively). The number of nNOS-positive neurons/mm length (E) did not change with age (slope = − 0.3 neurons/mm/10 yrs, p=0.18). The ratio of nNOS/Hu neurons (F) increased with age (slope = 0.03 per 10yrs, p=0.01). Panels G-L show representative examples of the changes seen with age. Panels G, H and I are from a 40 yr old colon and panels J, K and L from a 76 yr old colon. Panels G and H show neurons identified with HuC/D, panels H and K neurons identified with nNOS (arrows) and panels I and L the merged images. Two neurons out of 8 were immunoreactive for both HuC/D and nNOS (arrows) in the 40 yr old patient and two neurons out of 3 in the 76 yr old. Scale bar, 20μm.
Figure 3
Figure 3
PGP 9.5 immunoreactivity. Panel A shows data from the myenteric plexus, panel B from circular muscle and panel C from the submucosal plexus (C). Confocal images of PGP 9.5 stained colonic tissue were reconstructed and volumes measured. The data represents the percentage of PGP 9.5 fluorescence containing voxels as compared to the number of voxels in the image space. Each data point is the mean of 12 observations. No change in PGP 9.5 immunoreactivity was seen with age for the myenteric (A) plexus (−0.9%/10 yrs, p=0.65), the circular muscle (B) (−0.04%/10 yrs, p=0.59) or the submucosal plexus (+16.2%/10 yrs, p=0.22).
Figure 4
Figure 4
HuC/D does not label all human colonic neurons. Panel A shows a ganglion immunolabeled with HuC/D and panel B the same ganglion immunolabeled with ChAT.(arrows and arrowheads). Panel C shows the merged image showing a ChAT-positive neuron that was not HuC/D positive (arrowhead). Scale bar, 20μm.
Figure 5
Figure 5
Changes in neuronal numbers in the submucosal plexus of the normal human colon with age. The number of Hu-positive neurons/mm (A) and neurons/ganglion (B) did not change with age (slope = −0.3 neurons/mm/10yrs, p=0.09, −0.02 neurons/ganglion/10 yrs, p=0.8, respectively). The number of ganglia per mm declined with age (C, slope = −0.1 ganglion/mm/10 yrs, p=0.04). There was no significant changein the number of ChAT (D) or nNOS (E)-positive neurons with age (slope = −0.14 neurons/mm/10yrs, p=0.2 and −0.05 neurons/mm/10 yrs, p=0.68, respectively).

References

    1. Priebe HJ. The aged cardiovascular risk patient. Br J Anaesth. 2000;85:763–78. - PubMed
    1. Izzo JL, Jr., Mitchell GF. Aging and arterial structure-function relations. Adv Cardiol. 2007;44:19–34. - PubMed
    1. Hall K, Wiley JW. Age-associated changes in gastrointestinal function. In: Hazzard JP, Blass WR, Ettinger WH, Hatter JB, Ous Pander JP, editors. Principles of Geriatric Medicine and Gerontology. 4th ed. McGraw-Hill; New York: 1999. pp. 835–42.
    1. Melkersson M, Andersson H, Bosaeus I, Falkheden T. Intestinal transit time in constipated and non-constipated geriatric patients. Scand J Gastroenterol. 1983;18:593–7. - PubMed
    1. Evans JM, Fleming KC, Talley NJ, Schleck CD, Zinsmeister AR, Melton LJ., 3rd Relation of colonic transit to functional bowel disease in older people: a population-based study. J Am Geriatr Soc. 1998;46:83–7. - PubMed

Publication types