. 2009;182(2):451-460.
doi: 10.1111/j.1469-8137.2008.02755.x. Epub 2009 Feb 11.

Does photosynthesis affect grassland soil-respired CO2 and its carbon isotope composition on a diurnal timescale?

Affiliations

Does photosynthesis affect grassland soil-respired CO2 and its carbon isotope composition on a diurnal timescale?

Michael Bahn et al. New Phytol. 2009.

Abstract

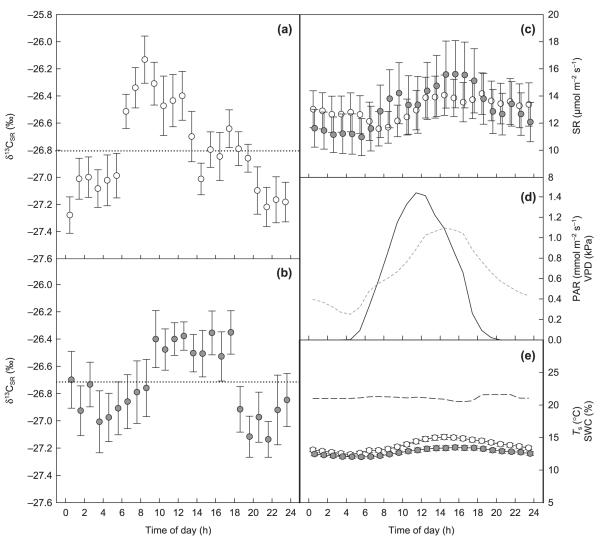
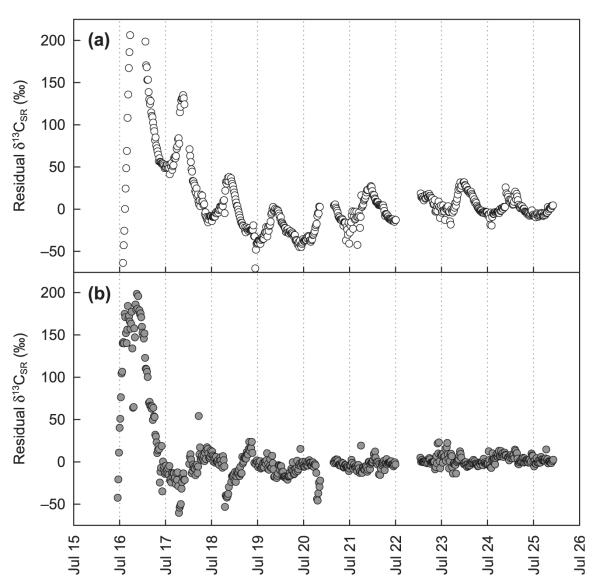
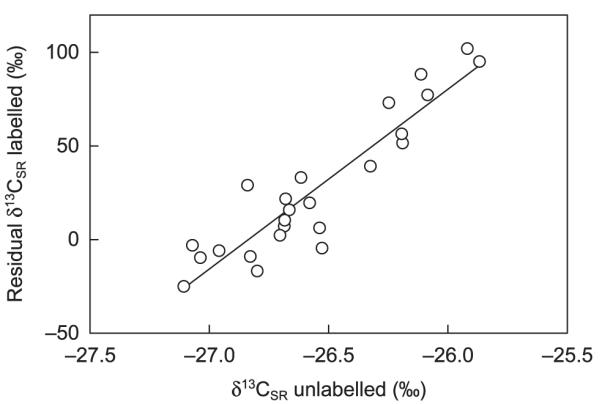
Soil respiration is the largest flux of carbon (C) from terrestrial ecosystems to the atmosphere. Here, we tested the hypothesis that photosynthesis affects the diurnal pattern of grassland soil-respired CO(2) and its C isotope composition (delta(13)C(SR)). A combined shading and pulse-labelling experiment was carried out in a mountain grassland. delta(13)C(SR) was monitored at a high time resolution with a tunable diode laser absorption spectrometer. In unlabelled plots a diurnal pattern of delta(13)C(SR) was observed, which was not explained by soil temperature, moisture or flux rates and contained a component that was also independent of assimilate supply. In labelled plots delta(13)C(SR) reflected a rapid transfer and respiratory use of freshly plant-assimilated C and a diurnal shift in the predominant respiratory C source from recent (i.e. at least 1 d old) to fresh (i.e. photoassimilates produced on the same day). We conclude that in grasslands the plant-derived substrates used for soil respiratory processes vary during the day, and that photosynthesis provides an important and immediate C source. These findings indicate a tight coupling in the plant-soil system and the importance of plant metabolism for soil CO(2) fluxes.


Figures

Fig. 1
Fig. 1
Averaged diurnal courses of (a, b) δ13C of soil-respired CO213CSR) in (a) unshaded and (b) shaded plots in a mountain grassland, (c) soil respiration in unshaded (open circles) and shaded (closed circles) plots, (d) photosynthetically active radiation (PAR; black line) incident on unshaded plots and vapour pressure deficit (VPD; dashed grey line) and (e) soil temperatures (Ts) (Ts unshaded, open circles; Ts shaded, closed circles) and soil water content (SWC; dashed line) at 5 cm depth. Averages were calculated by aggregating hourly means (based on 20-min measurement intervals) obtained in three plots for each treatment during three separate field campaigns between 15 July and 4 August 2007 (for details see the Materials and Methods). Error bars indicate standard errors; n = 13–16 and 10–12 for three unshaded and three shaded plots, respectively. Horizontal dotted lines in (a) and (b) represent the daily mean of δ13CSR.
Fig. 2
Fig. 2
Time course of (a, b) δ13C of soil-respired CO213CSR) after pulse labelling in (a) an unshaded and (b) a shaded plot in a mountain grassland, (c) soil respiration in shaded (closed circles) and unshaded (open circles) plots (mean values of the respective control and the labelled plot, normalized for each plot to average pretreatment values), (d) photosynthetically active radiation (PAR; black line) incident on unshaded plots and vapour pressure deficit (VPD; dashed grey line) and (e) soil temperatures (Ts) (Ts unshaded, dashed grey line; Ts shaded, black line) and soil water content (SWC; dashed line) at 5 cm depth. Insets in (a) and (b) show the period immediately after labelling on an enlarged scale.
Fig. 3
Fig. 3
Diurnal variation of δ13C of soil-respired CO213CSR) in labelled (a) unshaded and (b) shaded plots in the course of the first experiment, expressed as residuals of the respective decay curves shown in Table 1 in relation to observed values (Fig. 2a,b).
Fig. 4
Fig. 4
Relationship between hourly means of δ13C of soil-respired CO2 of unlabelled plots (δ13CSR unlabelled; x) and the residuals of the decay curve of labelled plots (residual δ13CSR labelled; y) for the unshaded treatments of the first experiment (y = 96.075x + 2578.2; R2 = 0.85, P < 0.001). Each hourly mean is based on an average of three hourly measurements for days with complete data sets (n = 7).

References

    1. Bahn M, Knapp M, Garajova Z, Pfahringer N, Cernusca A. Root respiration in temperate mountain grasslands differing in land use. Global Change Biology. 2006;12:995–1006.
    1. Bahn M, Kutsch W, Heinemeyer A. Synthesis: emerging issues and challenges for an integrated understanding of soil carbon dynamics. In: Kutsch W, Bahn M, Heinemeyer A, editors. Soil carbon dynamics. An integrated methodology. Cambridge University Press; Cambridge, UK: 2009. in press.
    1. Bahn M, Rodeghiero M, Anderson-Dunn M, Dore S, Gimeno S, Drösler M, Williams M, Ammann C, Berninger F, Flechard C, et al. Soil respiration in european grasslands in relation to climate and assimilate supply. Ecosystems. 2008;11:1352–1367. - PMC - PubMed
    1. Betson NR, Göttlicher SG, Hall M, Wallin G, Richter A, Högberg P. No diurnal variation in rate or carbon isotope composition of soil respiration in a boreal forest. Tree Physiology. 2007;27:749–756. - PubMed
    1. Boone RD, Nadelhoffer KJ, Canary JD, Kaye JP. Roots exert a strong influence on the temperature sensitivity of soil respiration. Nature. 1998;396:570–572.

Publication types