

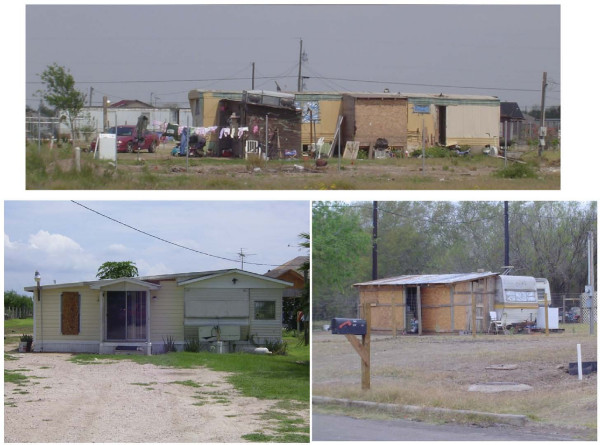
Association between neighborhood need and spatial access to food stores and fast food restaurants in neighborhoods of colonias
- PMID: 19220879
- PMCID: PMC2653484
- DOI: 10.1186/1476-072X-8-9
Association between neighborhood need and spatial access to food stores and fast food restaurants in neighborhoods of colonias
Abstract
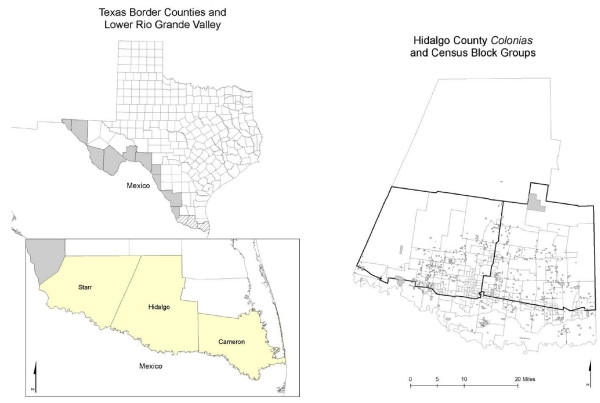
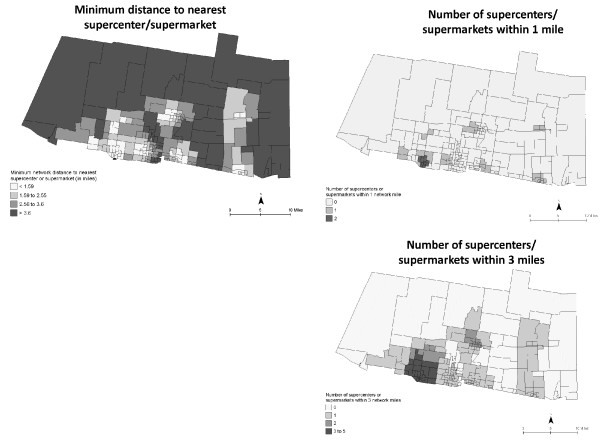
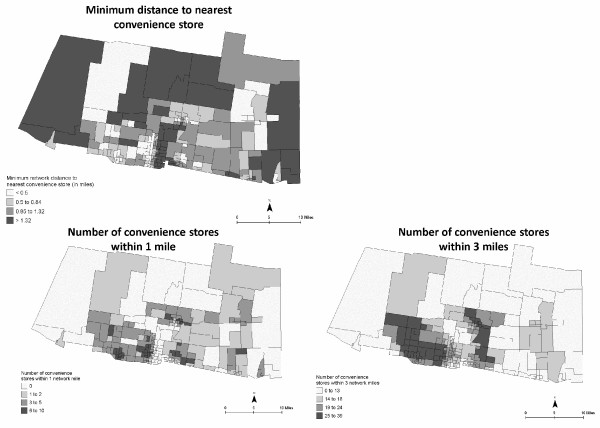
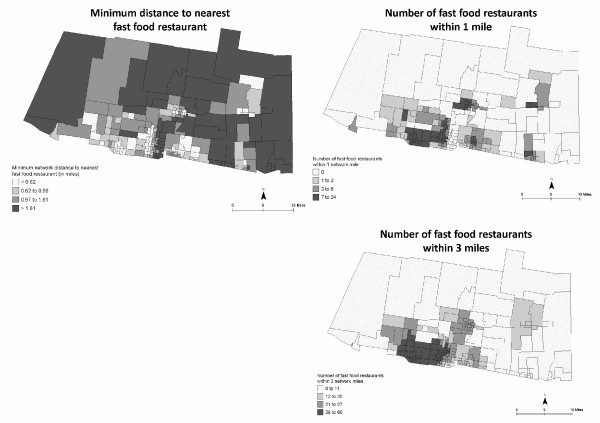
Objective: To determine the extent to which neighborhood needs (socioeconomic deprivation and vehicle availability) are associated with two criteria of food environment access: 1) distance to the nearest food store and fast food restaurant and 2) coverage (number) of food stores and fast food restaurants within a specified network distance of neighborhood areas of colonias, using ground-truthed methods.
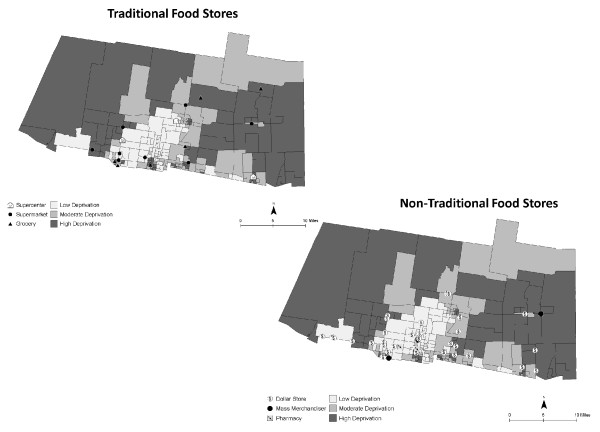
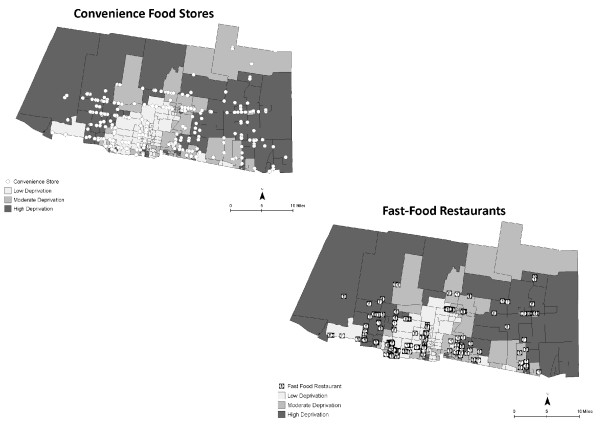
Methods: Data included locational points for 315 food stores and 204 fast food restaurants, and neighborhood characteristics from the 2000 U.S. Census for the 197 census block group (CBG) study area. Neighborhood deprivation and vehicle availability were calculated for each CBG. Minimum distance was determined by calculating network distance from the population-weighted center of each CBG to the nearest supercenter, supermarket, grocery, convenience store, dollar store, mass merchandiser, and fast food restaurant. Coverage was determined by calculating the number of each type of food store and fast food restaurant within a network distance of 1, 3, and 5 miles of each population-weighted CBG center. Neighborhood need and access were examined using Spearman ranked correlations, spatial autocorrelation, and multivariate regression models that adjusted for population density.
Results: Overall, neighborhoods had best access to convenience stores, fast food restaurants, and dollar stores. After adjusting for population density, residents in neighborhoods with increased deprivation had to travel a significantly greater distance to the nearest supercenter or supermarket, grocery store, mass merchandiser, dollar store, and pharmacy for food items. The results were quite different for association of need with the number of stores within 1 mile. Deprivation was only associated with fast food restaurants; greater deprivation was associated with fewer fast food restaurants within 1 mile. CBG with greater lack of vehicle availability had slightly better access to more supercenters or supermarkets, grocery stores, or fast food restaurants. Increasing deprivation was associated with decreasing numbers of grocery stores, mass merchandisers, dollar stores, and fast food restaurants within 3 miles.
Conclusion: It is important to understand not only the distance that people must travel to the nearest store to make a purchase, but also how many shopping opportunities they have in order to compare price, quality, and selection. Future research should examine how spatial access to the food environment influences the utilization of food stores and fast food restaurants, and the strategies used by low-income families to obtain food for the household.
Figures
References
-
- Booth SL, Sallis JF, Ritenbaugh C, Hill JO, Birch LL, Frank LD, Glanz K, Himmelgreen DA, Mudd M, Popkin BM, et al. Environmental and Societal Factors Affect Food Choice and Physical Activity: Rationale, Influences, and Leverage Points. Nutr Rev. 2001;59:S21–S39. - PubMed
-
- Ward PM. Colonias and Public Policy in Texas and Mexico. Austin, TX: University of Texas Press; 1999.
-
- Bread for the World Institute (BWI) Hunger Report http://www.bread.org/institute/hunger_report/2005-pdf.htm
Publication types
MeSH terms
Grants and funding
LinkOut - more resources
Full Text Sources
Research Materials
Miscellaneous
