

Comparison of molecular dynamics and superfamily spaces of protein domain deformation
- PMID: 19220918
- PMCID: PMC2666742
- DOI: 10.1186/1472-6807-9-6
Comparison of molecular dynamics and superfamily spaces of protein domain deformation
Abstract
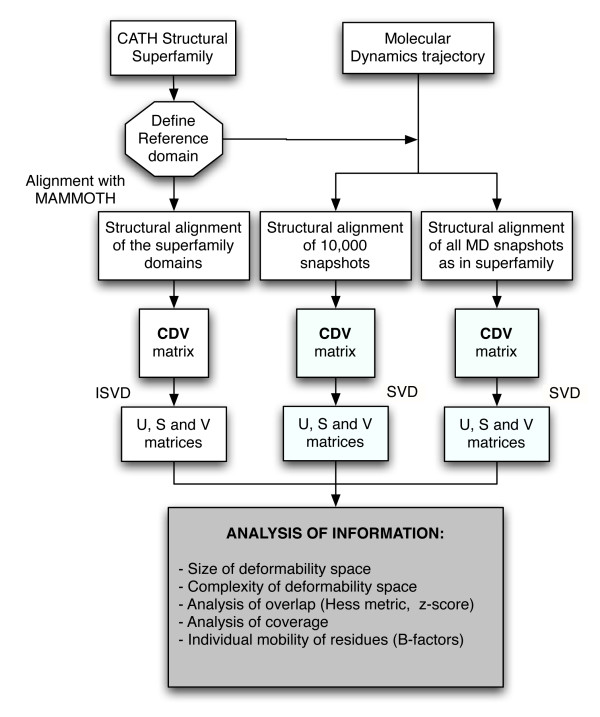
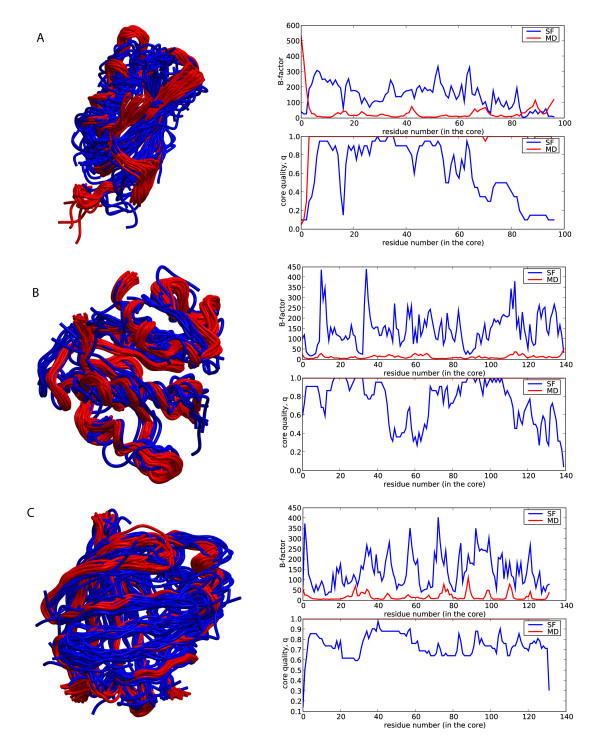
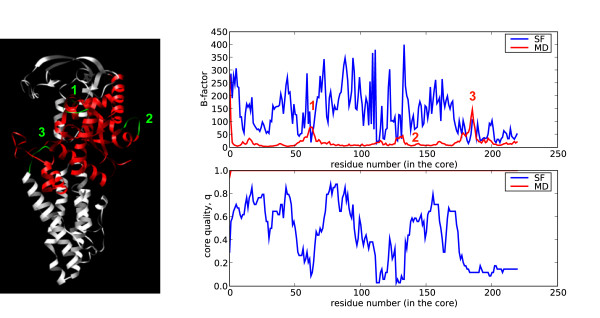
Background: It is well known the strong relationship between protein structure and flexibility, on one hand, and biological protein function, on the other hand. Technically, protein flexibility exploration is an essential task in many applications, such as protein structure prediction and modeling. In this contribution we have compared two different approaches to explore the flexibility space of protein domains: i) molecular dynamics (MD-space), and ii) the study of the structural changes within superfamily (SF-space).
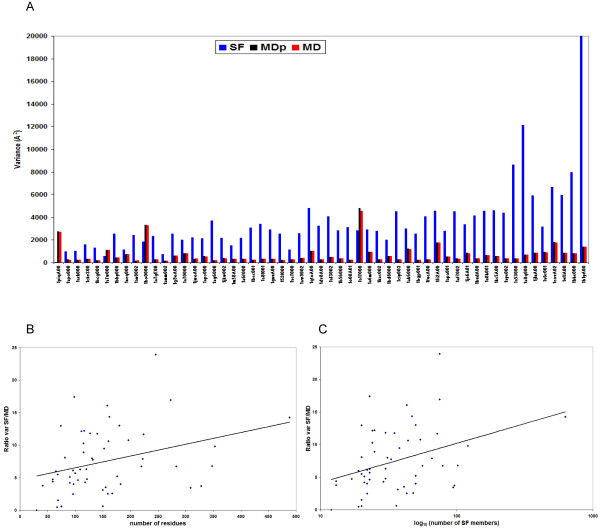
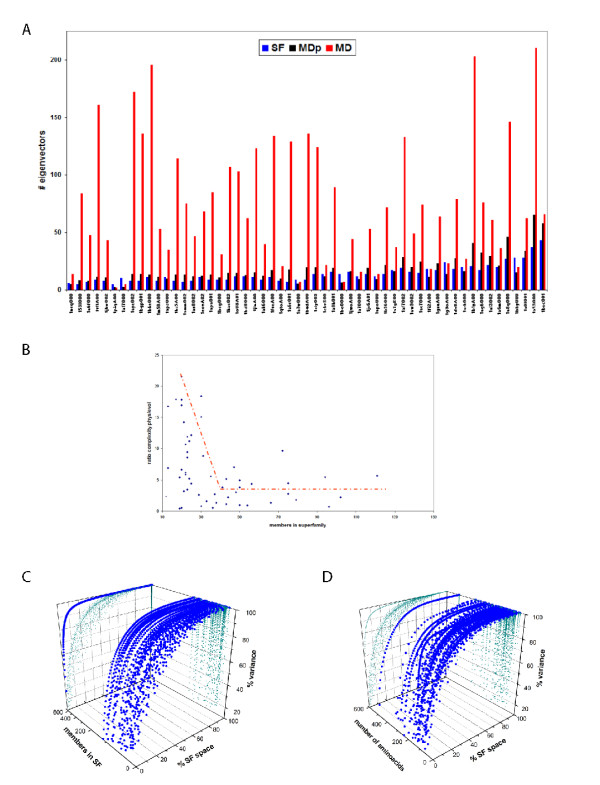
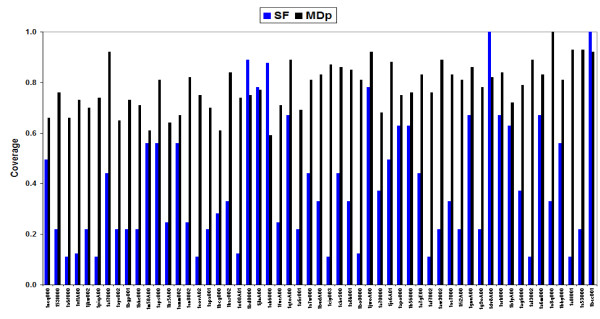
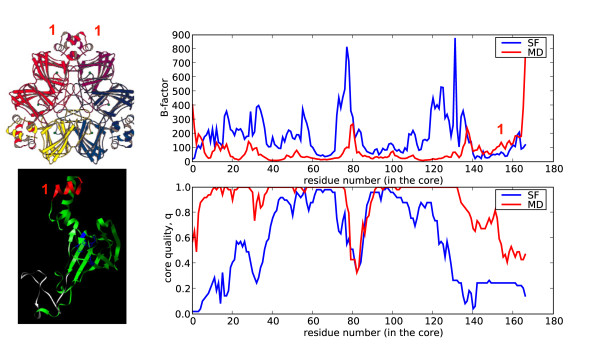
Results: Our analysis indicates that the MD-space and the SF-space display a significant overlap, but are still different enough to be considered as complementary. The SF-space space is wider but less complex than the MD-space, irrespective of the number of members in the superfamily. Also, the SF-space does not sample all possibilities offered by the MD-space, but often introduces very large changes along just a few deformation modes, whose number tend to a plateau as the number of related folds in the superfamily increases.
Conclusion: Theoretically, we obtained two conclusions. First, that function restricts the access to some flexibility patterns to evolution, as we observe that when a superfamily member changes to become another, the path does not completely overlap with the physical deformability. Second, that conformational changes from variation in a superfamily are larger and much simpler than those allowed by physical deformability. Methodologically, the conclusion is that both spaces studied are complementary, and have different size and complexity. We expect this fact to have application in fields as 3D-EM/X-ray hybrid models or ab initio protein folding.
Figures

Similar articles
-
Conservation and specialization in PAS domain dynamics.Protein Eng Des Sel. 2005 Mar;18(3):127-37. doi: 10.1093/protein/gzi017. Epub 2005 Apr 8. Protein Eng Des Sel. 2005. PMID: 15820977
-
Can molecular dynamics simulations help in discriminating correct from erroneous protein 3D models?BMC Bioinformatics. 2008 Jan 7;9:6. doi: 10.1186/1471-2105-9-6. BMC Bioinformatics. 2008. PMID: 18179702 Free PMC article.
-
Structure-function relationship of inhibitory Smads: Structural flexibility contributes to functional divergence.Proteins. 2008 Jun;71(4):1853-62. doi: 10.1002/prot.21869. Proteins. 2008. PMID: 18175316
-
Frontiers in molecular dynamics simulations of DNA.Acc Chem Res. 2012 Feb 21;45(2):196-205. doi: 10.1021/ar2001217. Epub 2011 Aug 10. Acc Chem Res. 2012. PMID: 21830782 Review.
-
The role and perspective of ab initio molecular dynamics in the study of biological systems.Acc Chem Res. 2002 Jun;35(6):455-64. doi: 10.1021/ar010018u. Acc Chem Res. 2002. PMID: 12069631 Review.
Cited by
-
Statistical learning of protein elastic network from positional covariance matrix.Comput Struct Biotechnol J. 2023 Mar 28;21:2524-2535. doi: 10.1016/j.csbj.2023.03.033. eCollection 2023. Comput Struct Biotechnol J. 2023. PMID: 37095762 Free PMC article.
-
Deep mutational scanning reveals the functional constraints and evolutionary potential of the influenza A virus PB1 protein.J Virol. 2023 Nov 30;97(11):e0132923. doi: 10.1128/jvi.01329-23. Epub 2023 Oct 26. J Virol. 2023. PMID: 37882522 Free PMC article.
-
WEBnm@ v2.0: Web server and services for comparing protein flexibility.BMC Bioinformatics. 2014 Dec 30;15(1):427. doi: 10.1186/s12859-014-0427-6. BMC Bioinformatics. 2014. PMID: 25547242 Free PMC article.
-
On the modularity of the intrinsic flexibility of the µ opioid receptor: a computational study.PLoS One. 2014 Dec 30;9(12):e115856. doi: 10.1371/journal.pone.0115856. eCollection 2014. PLoS One. 2014. PMID: 25549261 Free PMC article.
-
Comparison of the Internal Dynamics of Metalloproteases Provides New Insights on Their Function and Evolution.PLoS One. 2015 Sep 23;10(9):e0138118. doi: 10.1371/journal.pone.0138118. eCollection 2015. PLoS One. 2015. PMID: 26397984 Free PMC article.
References
-
- Shea JE, Brooks CL., 3rd From folding theories to folding proteins: a review and assessment of simulation studies of protein folding and unfolding. Annu Rev Phys Chem. 2001;52:499–535. - PubMed
-
- Rost B. Twilight zone of protein sequence alignments. Protein Eng. 1999;12:85–94. - PubMed
-
- Gerstein M, Lesk AM, Chothia C. Structural Mechanisms for Domain Movements in Proteins. Biochemistry. 1994;33:6739–6749. - PubMed
-
- Goh C-S, Milburn D, Gerstein M. Conformational changes associated with protein-protein interactions. Curr Opin Struct Biol. 2004;14:104–109. - PubMed
Publication types
MeSH terms
Substances
Grants and funding
LinkOut - more resources
Full Text Sources
