Nonalcoholic fatty liver disease: diagnostic and fat-grading accuracy of low-flip-angle multiecho gradient-recalled-echo MR imaging at 1.5 T
- PMID: 19221054
- PMCID: PMC2663579
- DOI: 10.1148/radiol.2511080666
Nonalcoholic fatty liver disease: diagnostic and fat-grading accuracy of low-flip-angle multiecho gradient-recalled-echo MR imaging at 1.5 T
Abstract
Purpose: To assess the accuracy of four fat quantification methods at low-flip-angle multiecho gradient-recalled-echo (GRE) magnetic resonance (MR) imaging in nonalcoholic fatty liver disease (NAFLD) by using MR spectroscopy as the reference standard.
Materials and methods: In this institutional review board-approved, HIPAA-compliant prospective study, 110 subjects (29 with biopsy-confirmed NAFLD, 50 overweight and at risk for NAFLD, and 31 healthy volunteers) (mean age, 32.6 years +/- 15.6 [standard deviation]; range, 8-66 years) gave informed consent and underwent MR spectroscopy and GRE MR imaging of the liver. Spectroscopy involved a long repetition time (to suppress T1 effects) and multiple echo times (to estimate T2 effects); the reference fat fraction (FF) was calculated from T2-corrected fat and water spectral peak areas. Imaging involved a low flip angle (to suppress T1 effects) and multiple echo times (to estimate T2* effects); imaging FF was calculated by using four analysis methods of progressive complexity: dual echo, triple echo, multiecho, and multiinterference. All methods except dual echo corrected for T2* effects. The multiinterference method corrected for multiple spectral interference effects of fat. For each method, the accuracy for diagnosis of fatty liver, as defined with a spectroscopic threshold, was assessed by estimating sensitivity and specificity; fat-grading accuracy was assessed by comparing imaging and spectroscopic FF values by using linear regression.
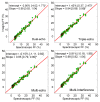
Results: Dual-echo, triple-echo, multiecho, and multiinterference methods had a sensitivity of 0.817, 0.967, 0.950, and 0.983 and a specificity of 1.000, 0.880, 1.000, and 0.880, respectively. On the basis of regression slope and intercept, the multiinterference (slope, 0.98; intercept, 0.91%) method had high fat-grading accuracy without statistically significant error (P > .05). Dual-echo (slope, 0.98; intercept, -2.90%), triple-echo (slope, 0.94; intercept, 1.42%), and multiecho (slope, 0.85; intercept, -0.15%) methods had statistically significant error (P < .05).
Conclusion: Relaxation- and interference-corrected fat quantification at low-flip-angle multiecho GRE MR imaging provides high diagnostic and fat-grading accuracy in NAFLD.
Figures


References
-
- Lavine JE, Schwimmer JB. Nonalcoholic fatty liver disease in the pediatric population. Clin Liver Dis 2004;8:549–558, viii–ix. - PubMed
-
- Farrell GC, Larter CZ. Nonalcoholic fatty liver disease: from steatosis to cirrhosis. Hepatology 2006;43(2 suppl 1):S99–S112. - PubMed
-
- Sanyal AJ. AGA technical review on nonalcoholic fatty liver disease. Gastroenterology 2002;123:1705–1725. - PubMed
-
- McCullough AJ. Update on nonalcoholic fatty liver disease. J Clin Gastroenterol 2002;34:255–262. - PubMed
-
- Clark JM. Weight loss as a treatment for nonalcoholic fatty liver disease. J Clin Gastroenterol 2006;40(suppl 1):S39–S43. - PubMed
Publication types
MeSH terms
Substances
Grants and funding
LinkOut - more resources
Full Text Sources
Other Literature Sources
Medical

