. 2009 Oct;19(10):2209-29.
doi: 10.1093/cercor/bhn256. Epub 2009 Feb 16.

The resting brain: unconstrained yet reliable

Affiliations

The resting brain: unconstrained yet reliable

Zarrar Shehzad et al. Cereb Cortex. 2009 Oct.

Abstract

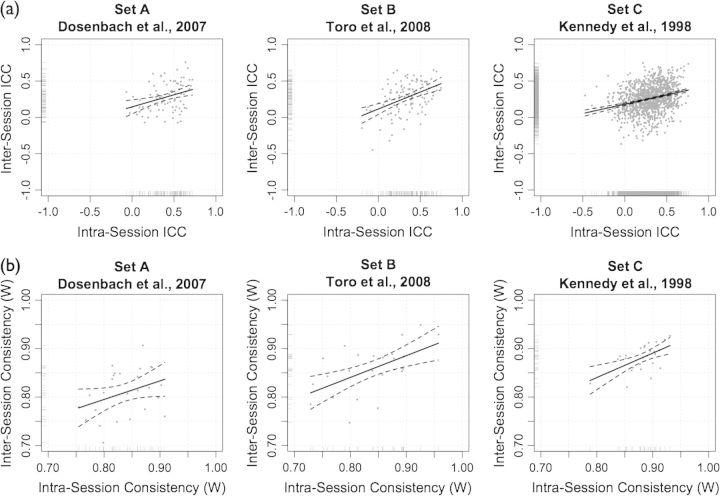
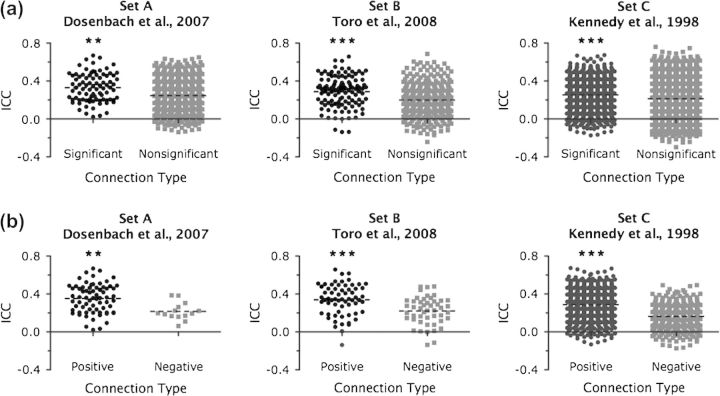
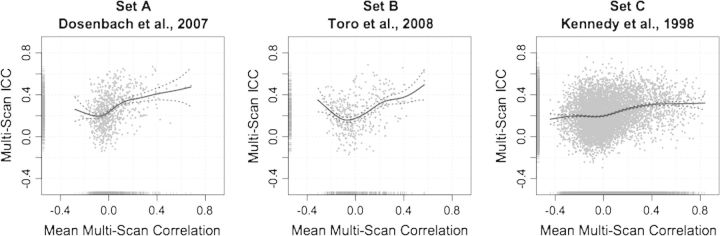
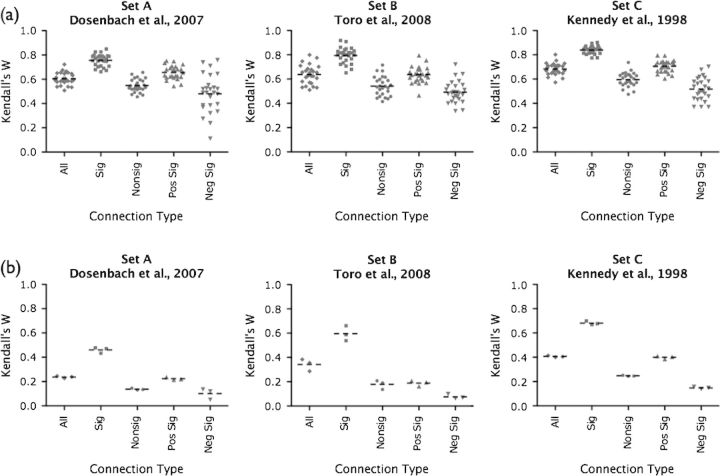
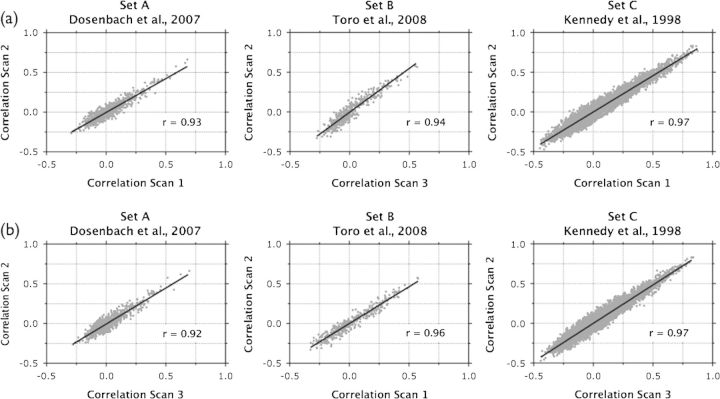
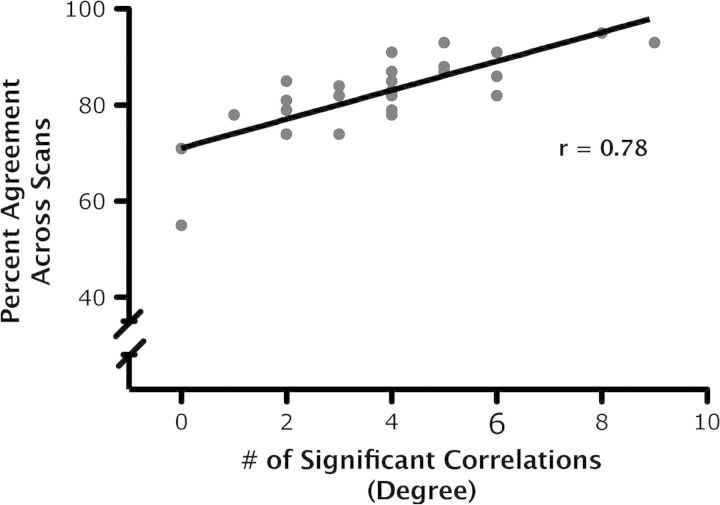
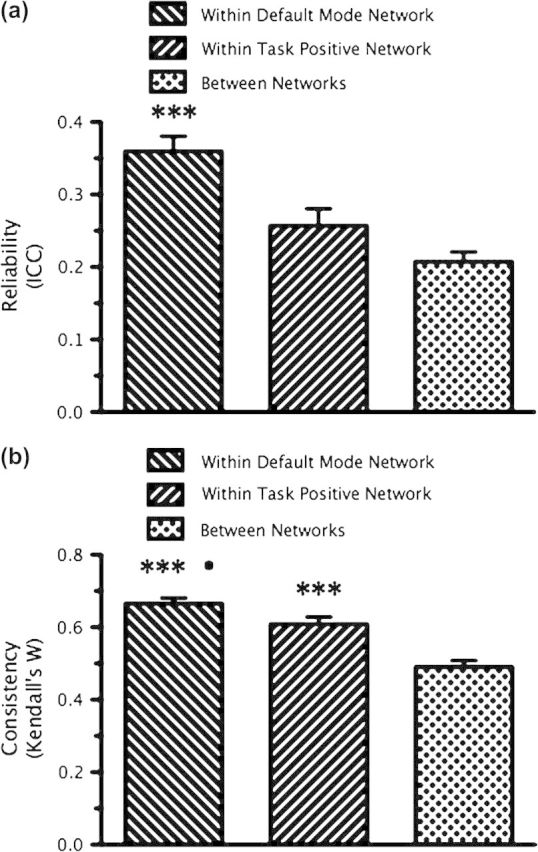
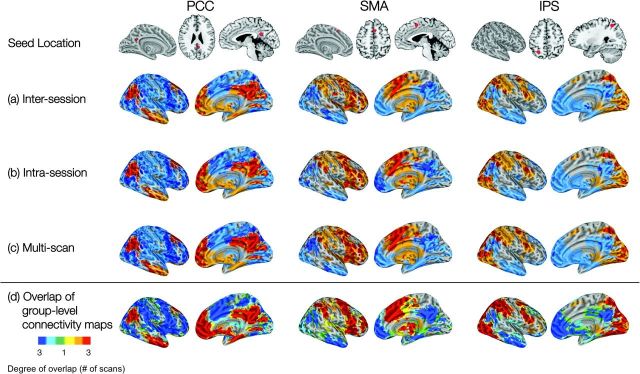
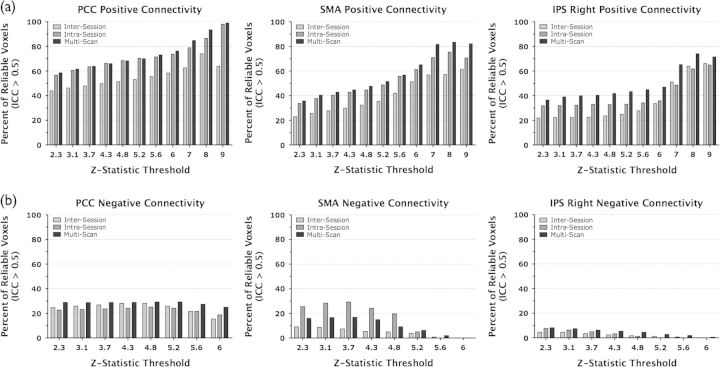
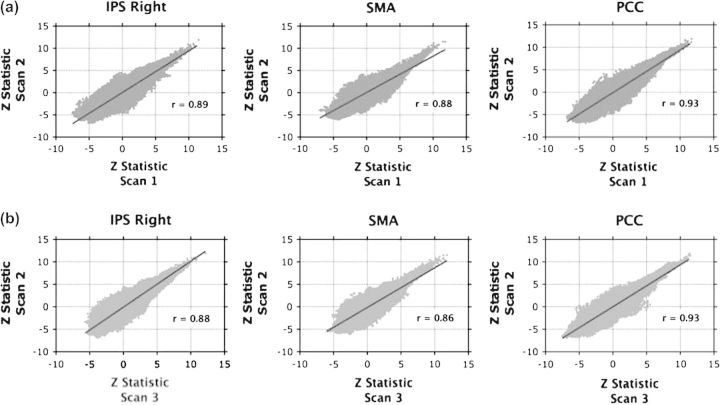
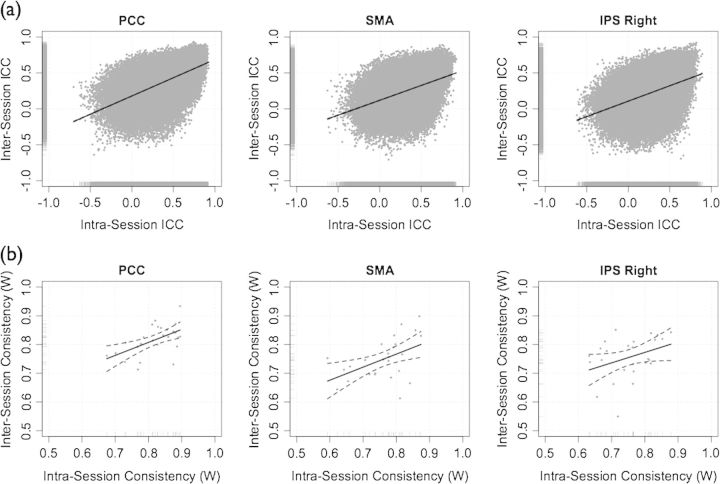
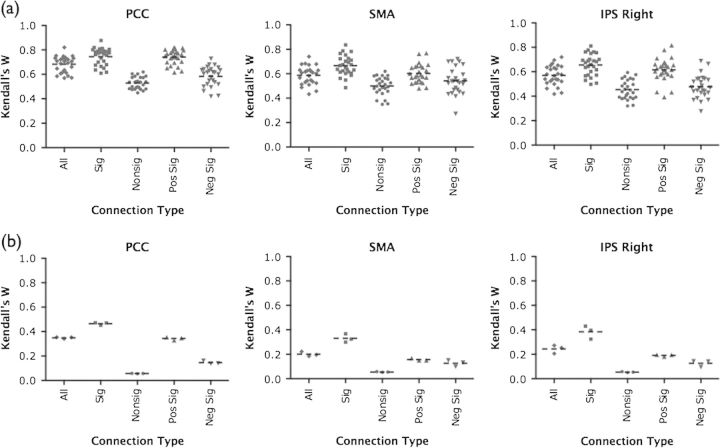
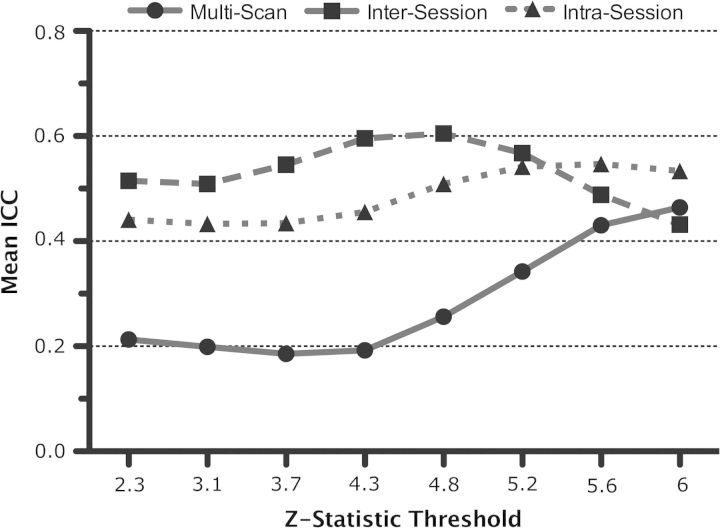
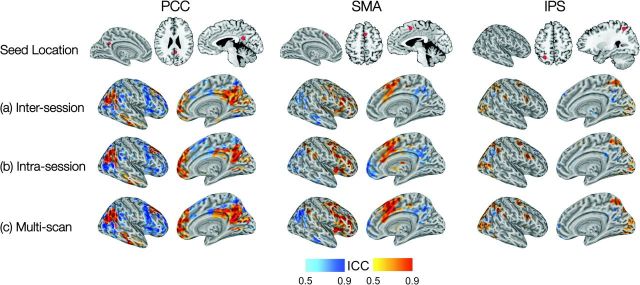
Recent years have witnessed an upsurge in the usage of resting-state functional magnetic resonance imaging (fMRI) to examine functional connectivity (fcMRI), both in normal and pathological populations. Despite this increasing popularity, concerns about the psychologically unconstrained nature of the "resting-state" remain. Across studies, the patterns of functional connectivity detected are remarkably consistent. However, the test-retest reliability for measures of resting state fcMRI measures has not been determined. Here, we quantify the test-retest reliability, using resting scans from 26 participants at 3 different time points. Specifically, we assessed intersession (>5 months apart), intrasession (<1 h apart), and multiscan (across all 3 scans) reliability and consistency for both region-of-interest and voxel-wise analyses. For both approaches, we observed modest to high reliability across connections, dependent upon 3 predictive factors: 1) correlation significance (significantly nonzero > nonsignificant), 2) correlation valence (positive > negative), and 3) network membership (default mode > task positive network). Short- and long-term measures of the consistency of global connectivity patterns were highly robust. Finally, hierarchical clustering solutions were highly reproducible, both across participants and sessions. Our findings provide a solid foundation for continued examination of resting state fcMRI in typical and atypical populations.


Figures

Figure 1.
Figure 1.
ROI-based analysis: inter- and intrasession reliability and consistency. (a) Intersession (scans 1 and 2) test–retest reliability (ICC) plotted against intrasession Scans 2 and 3) test–retest reliability. (b) Intersession consistency (Kendall's coefficient of concordance, W) plotted against intrasession consistency.
Figure 2.
Figure 2.
ROI-based analysis: factors effecting reliability. (a) Box plots of multiscan ICCs for significant and nonsignificant correlations, for each seed set. Dotted black lines represent the mean ICC for those correlations. **P < 0.001 and ***P < 0.0001, statistically significant correlations greater than nonsignificant correlations (Wilcoxon signed-rank test). (b) Box plots of multiscan ICCs for significant positive and significant negative correlations, for each seed set. Dotted black lines represent the mean ICC for those correlations. **P < 0.001 and ***P < 0.0001, significant positive correlations greater than significant negative correlations (Wilcoxon signed-rank test).
Figure 3.
Figure 3.
ROI-based analysis: correlation magnitude (functional connectivity) and reliability. The magnitude of each multiscan correlation (i.e., group-averaged correlation) plotted against its corresponding multiscan ICC, for each seed set. Rug plots are shown on each axis representing the distribution of correlations and ICCs. Solid lines represent spline-based nonparametric regression fits of the data and dotted lines represent the 95% confidence interval for the fit.
Figure 4.
Figure 4.
ROI-based analysis: factors effecting consistency. (a) Within-subjects multiscan consistency (Kendall's W) for 1) all correlations, 2) significant correlations, 3) nonsignificant correlations, 4) significant positive correlations, and 5) significant negative correlations. Each data point represents an individual participant's multiscan Kendall's W. Dotted black lines represent the mean Kendall's W (i.e., averaged across 26 participants). (b) Box plots of between-subjects multiscan consistency (Kendall's W) for correlations from each seed set. Data points represent the between-subjects Kendall's W for each of the 3 scans and dotted black lines represent the mean Kendall's W (i.e., averaged across 3 scans).
Figure 5.
Figure 5.
ROI-based analysis: consistency of group-averaged functional connectivity across scans. (a) Intersession: group-averaged correlations for scan 1 are plotted against group-averaged correlations for scan 2 for each seed set (data points represent r-values). Overlaid black lines represent linear regression fits of the data points and the r-values of the fit represent Pearson correlations of the data points (all comparison, P < 0.0001). (b) Intrasession: group-averaged correlations for scan 3 are plotted against group-averaged correlations for Scan 2 for each seed set and Pearson correlations comparing the 2 scans were significant (P < 0.0001) for all comparisons.
Figure 6.
Figure 6.
ROI-based analysis: hub regions. We observed a significant relationship (r = 0.78, P < 0.0001) between a region's degree of connectivity and its mean consistency of network membership for seed Set B (Toro et al. 2008). A region's degree of connectivity corresponds to the average number of significant correlations exhibited by that region, across the 3 scans. A region's consistency of network membership corresponds to the proportion of participants for whom that region was assigned to the same cluster as in Toro et al. (“percent agreement”).
Figure 7.
Figure 7.
ROI-based analysis: reliability and consistency of functional connectivity within and between the default mode and task positive networks. (a) Bars represent the mean (±SEM) multiscan ICC for significant correlations 1) within the default mode network, 2) within the task positive network, and 3) between the 2 networks. ***P < 0.0001, correlations within the default mode network were significantly more reliable than correlations within the task positive network or correlations between the 2 networks (Wilcoxon rank-sum test). (b) Bars represent the mean (±SEM) multiscan Kendall's W for sets of significant correlations within-subjects, across scans, 1) within the default mode network, 2) within the task positive network, and 3) between the 2 networks. •P < 0.05, sets of correlations within the default mode network were significantly more consistent than sets of correlations within the task positive network (Wilcoxon signed rank test). ***P < 0.001, sets of correlations within the default mode network and task positive network were more reliable than sets of correlations between the 2 networks (Wilcoxon signed rank test).
Figure 8.
Figure 8.
Voxelwise analyses: maps (“networks”) of positive (orange) and negative (cyan) functional connectivity. For each seed ROI, voxels exhibiting an ICC > 0.5 are overlaid in red (positive correlations) and blue (negative correlations). (a) Intersession ICC overlaid on intersession group-level connectivity map; (b) Intrasession ICC overlaid on intrasession group-level connectivity map; and (c) multiscan ICC overlaid on multiscan group-level connectivity map. (d) Depicts the overlap among the 3 scans for the group-level connectivity maps: yellow/green signifies voxels significantly positively/negatively correlated in only one scan; orange/cyan signifies voxels significantly positively/negatively correlated in 2 scans; and red/blue signifies voxels significantly positively/negatively correlated in all 3 scans.
Figure 9.
Figure 9.
Voxelwise analysis: comparison of reliability and increasing threshold values. (a) Bars represent the number of voxels that were significantly positively correlated with a seed region (Z > 2.3, i.e., suprathreshold voxels) and highly reliable (ICC > 0.5), expressed as a percentage of all suprathreshold voxels. Percent overlap is calculated for intersession, intrasession, and multiscan measures and for each seed region (PCC, SMA, and IPS right). At higher thresholds, a higher percentage of suprathreshold voxels are also highly reliable. (b) Bars represent the number of voxels that were significantly negatively correlated with a seed region (Z < −2.3) and highly reliable (ICC > 0.5). There is no effect of threshold on the proportion of reliable negative correlations.
Figure 10.
Figure 10.
Voxelwise analysis: consistency of group-level functional connectivity across scans. (a) Scatter plots of intersession consistency (scan 1 vs. scan 2) of group-level voxelwise fcMRI for each seed region (data points represent group-level regression parameter Z-statistics). Overlaid black lines represent linear regression fits for the data points and the r-values of the fit represent Pearson correlations (all comparisons, P < 0.0001). (b) Scatter plots of intrasession consistency (scan 2 vs. scan 3) of group-level fcMRI for each seed region and Pearson correlations comparing the 2 scans was significant (P < 0.0001) for all comparisons.
Figure 11.
Figure 11.
Voxelwise analysis: inter- and intrasession reliability and consistency. (a) Intersession (scans 1 and 2) test–retest reliability (ICC) plotted against intrasession (Scans 2 and 3) ICC, for each seed region. (b) Intersession consistency (Kendall's W) plotted against intrasession consistency for each seed region.
Figure 12.
Figure 12.
Voxelwise analysis: factors effecting consistency. (a) Plots of within-subjects multiscan consistency (Kendall's W) of correlations (voxelwise regression parameter estimates) for each seed. Shown are box plots representing consistency of 1) all correlations, 2) significant correlations, 3) nonsignificant correlations, 4) significant positive correlations, and 5) significant negative correlations. Each data point represents an individual participant's multiscan Kendall's W. Dotted black lines represent the mean Kendall's W (i.e., averaged across 26 participants). (b) Plots of between-subjects multiscan consistency (Kendall's W) for correlations (voxelwise beta parameter estimates) from each seed set. Data points represent the between-subjects Kendall's W for each of the 3 scans and dotted black lines represent the mean Kendall's W (i.e., averaged across 3 scans).
Figure 13.
Figure 13.
Voxelwise analysis: test–retest reliability of the default mode/task positive anticorrelation. ICC for the anticorrelation between the default mode and task positive networks increases with increasing Z statistic threshold values (beyond Z = 6, there was not a sufficient number of negatively correlated voxels). Mean intrasession and multiscan ICC increased over the full range of Z-statistic thresholds while mean intersession ICC increased up to Z = 4.8.
Figure 14.
Figure 14.
Voxelwise analysis: range of (a) Intersession ICCs; (b) intrasession ICCs; (c) multiscan ICCs. Maps of voxelwise reliability (ICC > 0.5) for suprathreshold (Z > 2.3) voxels that were positively (yellow–red) and negatively (cyan–blue) correlated with each seed ROI.

References

    1. Achard SA, Bullmore E. Efficiency and cost of economical brain functional networks. PLoS Comput Biol. 2007;3:e17. - PMC - PubMed
    1. Achard SA, Salvador R, Whitcher B, Suckling J, Bullmore E. A resilient, low-frequency, small-world human brain functional network with highly connected association cortical hubs. J Neurosci. 2006;26:63–72. - PMC - PubMed
    1. Aguirre GK, Zarahn E, D'Esposito M. The inferential impact of global signal covariates in functional neuroimaging analyses. NeuroImage. 1998;8:302–306. - PubMed
    1. Andrews-Hanna JR, Snyder AZ, Vincent JL, Lustig C, Head D, Raichle ME, Buckner RL. Disruption of large-scale brain systems in advanced aging. Neuron. 2007;56:924–935. - PMC - PubMed
    1. Birn RM, Diamond JB, Smith MA, Bandettini PA. Separating respiratory-variation-related fluctuations from neuronal-activity-related fluctuations in fMRI. NeuroImage. 2006;31:1536–1548. - PubMed

Publication types